
OUR VISION
The world's finest educators supporting science, technology, engineering, and math (STEM) learning for pre-kindergarten to post-graduate students using real-world applications from satellites and satellite data.
OUR MISSION
To enhance the education environment to excite students about science, technology, engineering, and math through space-based technology -- satellites and satellite data.

Franklin D. Roosevelt

One of the saddest lessons of history is this: If we’ve been bamboozled long enough, we tend to reject any evidence of the bamboozle. We’re no longer interested in finding out the truth. The bamboozle has captured us. It’s simply too painful to acknowledge, even to ourselves, that we’ve been taken. Once you give a charlatan power over you, you almost never get it back.
Carl Sagan

TABLE OF CONTENTS
Click a RED link to view article
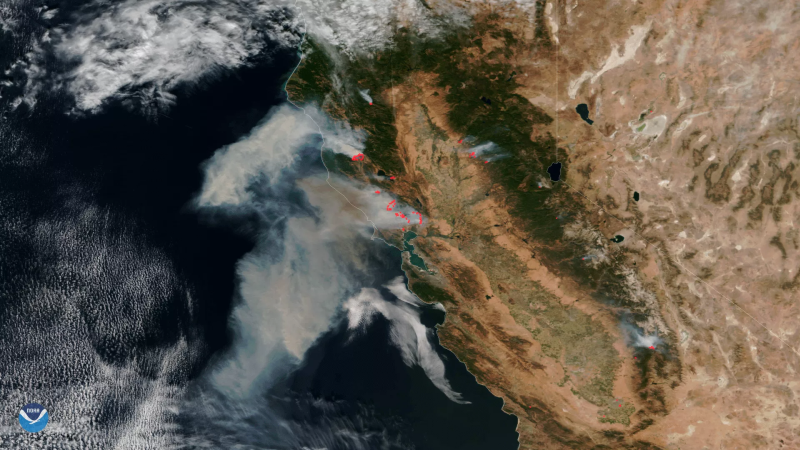
"Top 10" for 2021...
Association News
President's Corner
John's Journey
Satellites with Ed
News from NOAA
News from NASA
More Lessons
from the Sky
Go to SEA Home Page

By Pete Arvedson, Satellite Educators Association
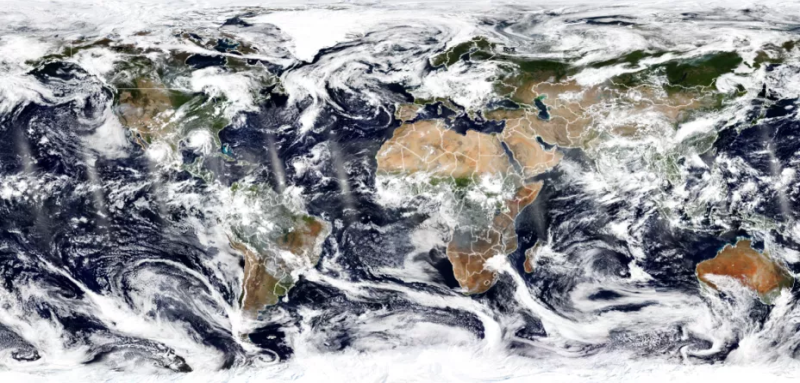
NASA, NOAA, and USGS all operate fleets of environmental satellites orbiting the Earth. Each satellite has its own set of sensors to monitor and report measurements of specific factors of the Earth's atmosphere, oceans, and land as well as space weather. Each agency often produces an annual "top 10" list of imagery for the year. NOAA's was released on December 30, 2021 and NASA's on January 25, 2022.
The images are from satellites operated by all three agencies. Each is significant as it tells a story of the changing Earth and how it affects every living thing on the planet. Each image includes a description of the source and content as well as a link to download the image. There is some, but very little, overlap in the lists. Each image in each list illustrates a significant event or phenomenon. Viewing each has a particular "Wow" factor worth sharing. With a little thought about the story each image carries, few viewers will escape an emotional impact.
Below is a list of the imagery in each "Top 10" collection reported here followed by links to each collection.
| NOAA's Top 10 | NASA's Amazing Earth |
| Ida nearing landfall | 2021's only total solar eclipse |
| Dust storm sweeps across Texas | Waiting to unload |
| Western wildfires rage | Finding gold mining hotspots in Peruh |
| La Soutrière erupts explosively | Tidal Vortices in the SEA of Okhotsk |
| Artic blast knocks out power | Exceptional heat hits Pacific Northwest |
| Iceberg breaks off Antarctica | Sweden's Siljan Ring |
| Wildfires spark thunderstorms | Leaf hunting in Japan |
| Texas-sized hail | The braided Paraná |
| An atmospheric river | River colors are changing |
| Astronomical shows of 2021 | First images from Landsat 9 |
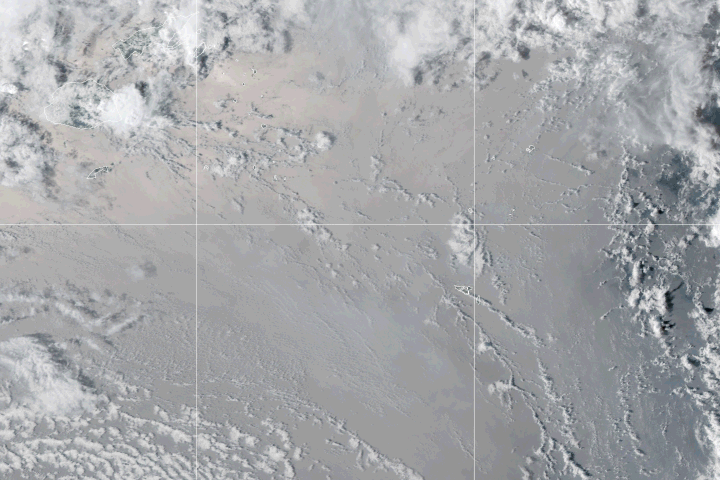
To round out the collection, I added another image set from NASA's Earth Observatory: an animation of NOAA GOES-17 imagery showing the eruption of a volcanic island in the South Pacific Kingdom of Tonga. The same volcano erupted in 2015 forming an island bridge between two smaller islands to make a single larger land mass that became relatively stable. Continuous eruptions in December 2021 and January 2022 completely obliterated that bridge leaving behind the two smaller islands and a lot of volcanic debris on the land, sea, and in the air. Let's start with that.
By Adam Voiland and Mike Carlowicz, NASA Earth Observatory
January 19, 2022
A powerful volcanic eruption has obliterated a small, uninhabited South Pacific island known as Hunga Tonga-Hunga Ha‘apai. Damage assessments are still ongoing, but reliminary reports indicate that some communities in the island nation of Tonga have been severely damaged by volcanic ash and significant tsunami waves.
Edited by Michael Block, NASA
January 25, 2022
In 2021, NASA’s fleet of Earth-observing satellites, as well as and instruments and astronauts on the International Space Station, captured some compelling moments on our planet.
From record-breaking heatwaves to pandemic-related events, the images in this list showcase some of the beautiful and complex events that occurred on our planet in the past year. They also demonstrate how NASA’s Earth-observing technologies and missions provide valuable information to scientists, government agencies, and people around the world.
With that, we invite you to look back at 2021 through the eyes of NASA’s satellites:
From NOAA National Environmental Satellite Data and Information Service
December 30, 2021
With their lofty view from space, NOAA satellites see the awe-inspiring beauty and the sobering destruction Mother Nature creates across our dynamic planet—and 2021 provided an eyeful. NOAA satellites caught monster hurricanes, severe thunderstorms, raging wildfires, erupting volcanoes, and even some celestial displays.
Below is our Top 10 list (in no particular order) of some of the most captivating events and images from 2021.
All of the images are available for download and repurposing, with credit to NOAA.

[ Back to Top ]


Members of the Satellite Educators Association will meet again via ZOOM on Saturday, February 12, 2022, beginning at 10:00AM PST to continue the discussion of the future of the Association and, in particular, the Satellites & Education Conference. Originally set for January 22, a major wind storm knocked out the electric power for 24 hours starting Friday night, January 21. The power outage was confined to a small area that included SEA headquarters where the ZOOM meeting was to be hosted. This and multiple related factors prevented successful work-arounds, and the meeting was finally cancelled. With member input, the SEA Executive Committee determined the next best date for the meeting is February 12.
The February 12 meeting will extend a conversation that began at the annual business meeting on July 24, 2021 following Satellites & Education Conference XXXIV and continued on October 23, 2021, both on ZOOM. It is hoped even more "Active" members will log in on February 12 to give input.
While many conference details are yet to be finalized, it can be reported at this time that Satellites & Education Conference XXXV will be offered on Friday-Saturday, July 29-30, 2022 in a hybrid format, that is both face-to-face and on ZOOM. The conference will be hosted by the Charter College of Education at California State University, Los Angeles and supported by NASA, NOAA, and aerospace leaders like Raytheon. More information will become available at and after the February 12, 2022 meeting.
This will serve as official notice that the Satellite Educators Association, Inc. calls a meeting of its membership on Saturday, February 12, 2022, starting at 10AM PST. Two hours have been blocked out for the meeting, but conversations could continue longer if needed. Active members will receive ZOOM login directions by e-mail during the week preceeding February 12.
To particpate in the meeting, membership must be "Active" (dues paid through July 2022). To renew your membership or join SEA for the first time, click HERE or visit https://SatEd.org and click the Join Us button.
[ Back to Top ]
Mark your calendars now for the 35th annual Satellites & Education Conference to be held Friday-Saturday, July 29-30, 2022 at California State University, Los Angeles. This outstanding event for teachers has been offered each and every year since 1988. This time, the conference will feature a hybrid format where registered attendees will be welcomed in-person as well as on ZOOM. Plans for the conference are underway.
Would you like to be part of the planning for this magnificent conference? You can - by participating in the next SEA members meeting on February 12, 2022. The meeting will start at 10AM PST on Saturday, February 12, 2022. All "Active" members are welcome. To renew your membership to Active status or join SEA for the first time, click HERE or visit https://SatEd.org and click the Join Us button.
[ Back to Top ]


by Monica Maynard, President, Satellite Educators Association
Happy New Year, SEA Colleagues! I hope you are well and staying healthy. Many of us have returned to work in person and have had to modify our routines to accommodate all the changes with respect to physical distancing, vaccination status, and hand hygiene, not to mention local mandates and workplace procedures. Educators across the US are overwhelmed and, in many cases, struggling. Currently, we are experiencing higher teacher burnout and desire to leave the profession than in years past. Therefore, it is vital that we continue to support educators by providing quality resources and opportunities to encourage them.
But as good scientist and professionals, we don’t dwell in the negative and instead find ways to move forward. I’d like to highlight some great engineering projects that have taken place recently. Most notably is the launch and successful deployment of the James Webb Space Telescope (JWST) on Christmas Day. The JWST is an infrared telescope, and the largest space telescope ever built, which will serve as the premier observatory studying the origins of the universe as well as the evolution of our solar system.
One thing that comes to my mind when I think of the JWST is, collaboration. This is a human feat that has been in the works for decades and brings scientists and engineers from around the world to work for a common goal. Thousands of people from over 14 countries have worked on the JWST in some capacity. This is a reminder to us, and to our students, that if we work together, we can accomplish great things.
I am excited for the images that the JWST will provide and invite you and your students to follow the JWST next steps at https://jwst.nasa.gov/index.html.
I encourage you to continue to look for those glimpses of light and opportunities that will help us improve. And, consider joining us in-person or via ZOOM for Satellites & Education Conference XXXV, July 29-30, 2022 at California State University, Los Angeles.
Until next time, stay safe and healthy!
Monica Maynard
[ Back to Top ]


By Ron Gird, Meteorologist and former Satellite/Spaceflight and Outreach Program Manager for the National Weather Service
Data reported by both NOAA and NASA show 2021 was the 6th warmest year on record. While that is one of many indicators of global climate change, we must not forget that the long-term climate picture is created from many daily, even hourly, weather records. Today, weather is observed by offices of NOAA such as the National Weather Service's Weather Prediction Center (WPC). The article below is a short Q&A with the Greg Carbin, the WPC Forecast Operation branch chief in College Park Maryland. Here Greg shares some of how the "big picture" from satellite imagery is combined with other data and shared with local offices around the country in a collaboration that attempts to fine tune an accurate forecast for your zip code area. Enjoy
Fron NOAA News & Features
January 24, 2018
For 75 years, NOAA’s Weather Prediction Center, in College Park, Maryland, has delivered lifesaving weather forecasts for significant events that involve precipitation – such as rain, sleet, and hail and that produce flash floods, tropical cyclones and extreme snowfall.
We sat down with Greg Carbin, chief of the Center’s forecast operations branch, to talk about how meteorologists across NOAA work with WPC to produce accurate, timely predictions for the larger U.S. and down to your own Zip Code.
[ Back to Top ]


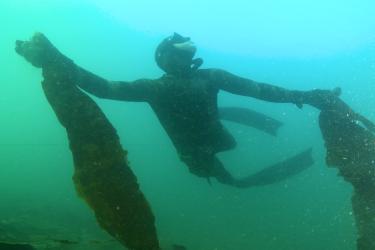
By John D. Moore, Executive Director, Institute for Earth Obervations at Palmyra Cove, New Jersey
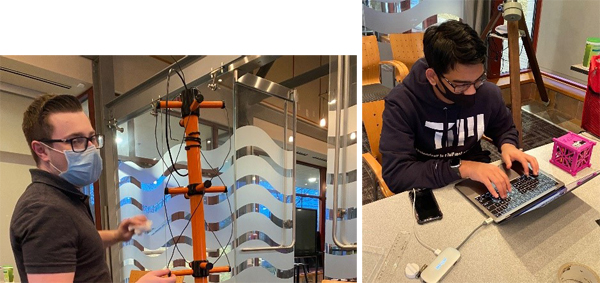
Working with Dr. Jin Kang and his colleagues, the A3Sat model has been identified as a "Tier 1" spacecraft simulator, and is currently being used as part of a 3-Tier Pedagogy and Space Workforce Development strategy as a result of a collaborative effort with the US Naval Academy, and researchers at Stanford University. You may recall from other John’s Journey or the Satellites and Education Conference last summer, the A3Sat engineering project allows students to build an active model the design of which mirrors many aspects of actual CubeSats prepared for launch into space. The A3Sat model incorporates a large number of sensors on an Enviro+, an integrated board for environmental monitoring with Raspberry Pi.
A3Sat was created as a realistic and authentic model where students can engage in multiple activities in the same way professional engineers build actual space-ready CubeSats. As a component of the design, a "launch experience" was added utilizing a drone. However, to ensure access to the project by a wider audience, experimental designs with the NASA Aerokats Project (kites), and/or tethered balloons are available alternative “launch” options. One of the main goals is to design and provide the most technically accurate model for the lowest price possible without excluding any demographic. An additional key objective of the project has been to broaden participation in the aerospace community at the precollege level.
Max Friedman and Sriram Elango, A3Sat student developers, collaborated on the engineering and design portion of the project, and the development of a Ground Station. A3Sat has been programed to send data and imagery to a designed ground station replicating the collection and transmission of data by real operational environmental satellites. The app is a desktop software compatible with both macOS and Windows. It is able to communicate and transfer data through Python socket communication. Students are able to pair the A3Sat and the computer through a WIFI hotspot from the Raspberry Pi, and further control the A3Sat from the app while also viewing real-time environmental data, health data (such as CPU intensity), as well as infrared and regular images. Built within the Ground Station app are data analysis and visualization tools, such as data plotting of all environmental data, as well as a 3D graph visualization of the altitude/displacement of the A3Sat. Students are able to conduct data analysis while the A3Sat is still in flight, viewing data streamed into the app while also being plotted live within both the 3D visualization and various graphs. In order to enable greater data analysis and promote students’ data literacy, the app can export collected data in Excel files of allowing students to apply the data in the context and further analysis. Developed by Sriram, the app has been recognized by New Jersey Congressman Andrew Kim as part of the Congressional App Challenge being held virtually this year April 20-22.
Recently, I was interviewed by my friend Kevin Simmons on his Aerospace Innovation Academy Podcast. Kevin, who was also an Einstein Fellow, is a major CubeSat enthusiast. You can check it out at https://www.youtube.com/watch?v=9NURrRryfQo. Kevin and his team of Middle School students from the Weiss School in Florida have built and launched CubeSats into space, the first middle school students to do so in the USA. Kevin and his students have therefore proven that activities such as these are entirely appropriate for precollege students. Kevin will be evaluating the A3Sat project for authenticity of the experience and student process.
Meanwhile, A3Sat “kits” have been distributed to groups around the United States, a GLOBE Partner in Kenya, and a school in England. These kits were funded as a part of the GLOBE Mission Earth grant and P.I. Dr. Kevin Czajkowski from the University of Toledo. (https://www.globe.gov/web/mission-earth).
As a kind of a “Back to the Future” moment, while Max was home for the semester break, he began working on the design and construction of a direct read-out antenna that would be easy to build and very inexpensive. “Back to the Future” because the Satellites & Education Conference began in the late 1980s with a group of high school students in Pennsylvania who built and successfully operated a weather satellite direct read-out station. With their collected print-outs of satellite-based weather data, they analyzed weather changes from ground and space making forecasts more accurately than the local broadcast meteorologists. Max is experimenting with a smaller 3D printed antenna that can easily be carried into the field to receive images. The goal: To introduce students to the value and excitement of receiving real-time satellite data with affordable equipment. More detailed reports of this aspect of the project will be forthcoming as the antenna plans develop. Of course, student participation in project like this opens a door to image analysis, interpretation, and application just as operating a direct read-out station in the classroom did more than 30 years ago. We hope to inspire a whole new generation of students to the discipline of satellites and remote sensing as satellites, space travel, and missions to the Moon, Mars, and beyond continue to rapidly expand.
Those with long-time involvement with SEA will recognize that the A3Sat project closely aligns with the founding ideas, vision, mission, and goals of the SEA from the beginning. A3Sat is an opportunity for any in the education community to engage students in authentic STEM integration with activities that have practical real-world applications. Let’s work together to talk it up, spread the word, generate interest, and continue to lessen the gap between Science and Science Education – a topic discussed in previous editions of John’s Journey.
Remember - “you can teach anything with satellites”.
Stay safe - stay well!
For now, I'm John...and this is my journey.
[ Back to Top ]

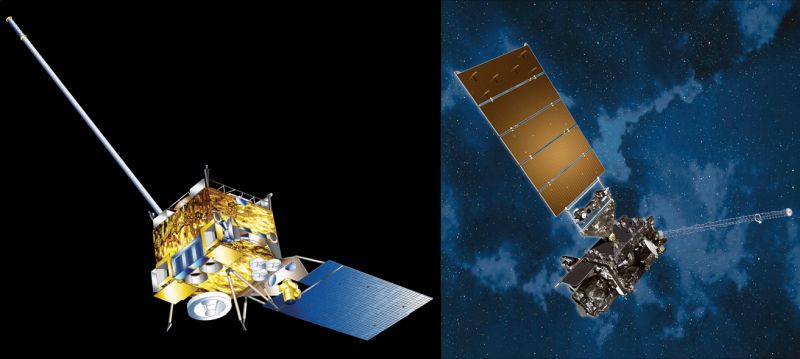
By Edward Murashie, President, Proengineered Solutions
GOES-T, Americas’ next weather satellite, is set to launch on March 1 at 4:38pm EST out of Cape Canaveral Space Force Station on an Atlas V rocket. What is GOES-T? How did it get its name?
GOES is the acronym for Geostationary Operational Environmental Satellite. What does "geostationary" mean? If you throw a baseball, two forces determine its path: inertia keeps it going forward while gravity pulls it to the ground. The harder you throw the ball, the more inertia the ball has and the farther away it will travel before hitting the ground. Same thing with a satellite, although a satellite is “thrown” by launching it on a rocket. The rocket system provides the satellite with greater inertia or velocity with which it reaches a higher altitude. When a satellite is “thrown” with enough inertia or velocity to balance the downward pull of gravity at a particular altitude, the satellite continues to travel in a curved path around the Earth – an orbit. The higher the altitude, the less gravitational pull, the lower the altitude the stronger the gravitational pull. Therefore, more inertia or velocity is needed to balance gravity at a lower altitude; less at a higher altitude. As the satellite’s altitude increases, its velocity must decrease to stay in orbit instead of flying out into space. At an altitude of approximately 36,000 kilometers (about 22,000 miles) and at zero degrees latitude, a balance is found where the satellite’s velocity matches the rotational speed of the Earth. If you were on the satellite looking toward the Earth, the Earth would look motionless while the clouds would move. You would be geostationary! This is a real advantage especially if, for example, you want to watch the path of a hurricane over time. You can see what the Earth looks when seen from a GOES satellite by visiting NOAA STAR’s GOES Imager Viewer found at https://www.star.nesdis.noaa.gov/goes/index.php. Most of the imagery is updated every five minutes.
What about the “T” in GOES-T? Weather satellites are given a sequential letter designation during planning, and are built in sets also called series. The GOES-R series is a set of fourth generation GOES satellites consisting of GOES-R, S, T and U. Once launched and in orbit, satellites are renamed with the next sequential number for that satellite type. For example, GOES-R became GOES-16. You may notice that R is not the 16th letter of the alphabet. Satellites are numbered only after reaching operational orbit. For example, it was decided that GOES-Q would not be built so it never renamed with a number. The next sequential number went to the next satellite of that type to reach operational orbit. GOES-R was renamed GOES-16 after it was launched on November 19, 2016 and placed in geostationary orbit. GOES-S was launched March 1, 2018 and renamed GOES-17 when it reached orbit. The next satellite in the GOES-R series is GOES-T. The planned launch of GOES-T will be on March 1, 2022. To learn more about the GOES-R series, visit https://www.goes-r.gov/.
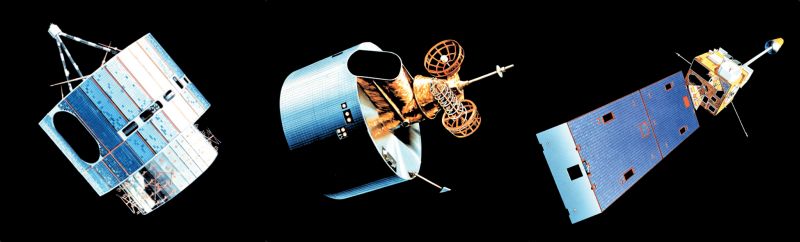
Each set or series advances the state of the art. For example, the GOES-R series has more capabilities than the third generation GOES-N series (GOES-N, O, P, Q which became GOES-13, 14, 15). New capabilities of GOES-R series hardware include a lightning mapper and space weather monitoring with a sun imager. Existing imager capabilities were improved with three times more wavelength channels, two times the spatial resolution, and three times temporal resolution, with up to a localized image rate of 30 seconds. The new specifications are 16 wavelength channels, up to 0.5km visible wavelength spatial resolution, 2km infrared, 6 full disk images per hour, 12 contiguous United States images per hour and a localized mesoscale image up to every 30 second. The large visible channel images are up to an impressive 10848 pixels by 10848 lines, quite large. These capabilities all help improve forecast accuracies. To learn more about the satellite details, checkout the GOES-R Data Book at https://www.goes-r.gov/downloads/resources/documents/GOES-RSeriesDataBook.pdf.
Even though each GOES satellite in equatorial orbit can view an entire Earth hemisphere at once, two satellites are used to effectively cover the USA from Alaska to the east of Florida. GOES-17 is in the GOES-West position because it is located at 137.2° W Longitude, 0° Latitude, and it “sees” the United States and most of the Pacific Ocean. GOES-16, also known as GOES-East, is located at 75.2° W Longitude, 0° Latitude and provides views of the United States and most of the Atlantic Ocean. The GOES-East position allows greatest views of North Atlantic hurricanes. When the newer GOES-R series satellites were ready they replaced older GOES-N satellites.
What happens if a satellite “breaks”? GOES-17 has an efficiency issue with its on-board heat pipe, the device that transfers heat away from the imager electronics and to the radiator. The result is the infrared channel temperatures are warmer than designed, and the variations are not consistent. The result is loss of imagery which can appear as striping in the image. For this reason the plan is to replace GOES-17 (GOES-S) with GOES-T, which will become GOES-18 once in orbit. While still on the ground, modifications were made to GOES-T to fix the heat pipe issue. Additionally, some of the older still functional satellites such as GOES-14 (GOES-O) and GOES-15 (GOES-P) are kept in a storage or backup mode. If needed, one of these older GOES satellites in backup mode can be moved to into place to temporarily replace a malfunctioning satellite.
The current GOES-T plan is to launch on March 1 and raise the satellite to geostationary orbit at 89.5° W by March 23. Spacecraft checkout, calibration, and the first image will take place between March 23 and July 25. The satellite will then drift to 136.8° W, arrive on station August 1 where GOES-18 imagery will be interleaved with GOES-17 imagery through September 6. If all goes well, GOES-18 will be handed over to NOAA’s OSPO operations office on October 3. From January 1-11, GOES-18 will drift into operational position at 137.2° W and on the 12th will be declared operational, replacing GOES-17. GOES-17 will drift to 105° W where it will be placed in storage mode. To stay up-to-date on any plan changes, visit https://www.goes-r.gov/users/transitionToOperations18.html.
So what comes next? The launch of GOES-U is planned for April 30, 2024. After successful launch, GOES-U could be renamed GOES-19. The next generation series of geostationary weather satellites after the GOES-R series is still in the planning stages. It will be called GeoXO, an acronym for Geostationary Extended Observations. The planned advances in GeoXO will be a quantum leap above GOES-R. Stay tuned to https://www.nesdis.noaa.gov/next-generation-satellites/geostationary-extended-observations-geoxo as GeoXO develops.
[ Back to Top ]


From NOAA National Environmental Satellite Data and Information Service
January 19, 2022
NOAA’s Earth-observing data play an integral role in our everyday lives—from understanding and predicting changes in climate, weather, oceans and coasts, to conserving and managing coastal and marine ecosystems and resources. However, there is still an enormous potential to improve how we understand, value, and use this essential environmental information.
Recognizing this, NASA and NOAA are co-sponsoring a Call for Proposals for Socioeconomic Assessments (SEA), which seeks to expand the research, methodologies, tools, and capacity for assessments of the socioeconomic value from Earth science information for real-world decisions and operations. The United States Geological Survey (USGS) serves as a collaborator to this activity and will host the outputs, materials, and results of the awarded groups in their international Societal Benefits Repository.
[ Back to Top ]

From NOAA National Environmental Satellite Data and Information Service
January 13, 2022
On Jan. 1, 2022, just before 11:30 am local time, there were numerous citizen and media reports (as well as many emergency calls to 911) describing multiple sonic booms heard in southwestern Pennsylvania. The area was cloudy at the time, but the Geostationary Lightning Mapper (GLM) onboard the GOES East satellite detected the likely source of the sounds—a bolide, or large meteor exploding in the atmosphere. NWS Pittsburgh tweeted out a GLM image to explain the event, which was used in local, national, and international media coverage.
A nearby infrasound station registered the blast wave from the meteor as it broke apart, and the data enabled NASA to estimate the energy was similar to 30 tons of TNT. Additionally, they estimated the size to be about a yard in diameter, with a mass close to half a ton. Had it not been cloudy, the fireball would have been easily visible in the daylight sky—estimates indicate it was about 100 times the brightness of the full moon.
[ Back to Top ]
From NOAA News & Features
December 20, 2021
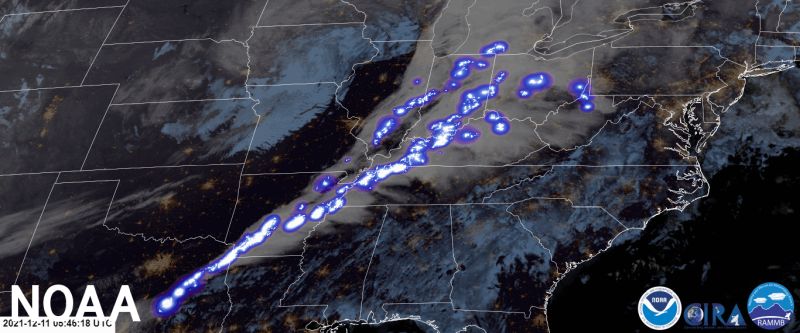
The tornadoes that ripped across the central and southern U.S. late in the evening of December 10, 2021, were notable in many ways.
The thunderstorms and tornadoes they produced traveled far — sometimes far more than 100 miles — and the impacts were widespread. NOAA's National Weather Service has confirmed 61 tornadoes as of December 18. The very fact that tornadoes of this intensity struck in late autumn, rather than in the spring and summer when thunderstorms and tornadoes are more likely, is remarkable.
Eight states — Kentucky, Arkansas, Tennessee, Missouri, Illinois, Georgia, Ohio and Indiana — reported tornadoes that killed more than 80 people and brought devastating damage to communities.
As we gather more data about this event, NOAA scientists have answered key questions about the potential influence of climate change on tornadoes:
[ Back to Top ]
From NOAA Fisheries News
January 24, 2022
Climate change refers to changes that have been happening since people have been putting carbon dioxide and other greenhouse gases up in the atmosphere. The changing climate includes changes in the earth's atmosphere, changes in our ocean—due to human activities—that have led to warming of the planet.
The changing climate and oceans have significant impacts on the nation’s valuable marine life and ecosystems, and the many communities and economies that depend on them.
Scientists expect environmental changes such as warming oceans, rising sea levels, frequency and intensity of floods and droughts, and ocean acidification to increase with continued shifts in the planet’s climate system.
Climate change will affect every aspect of NOAA Fisheries' mission—there is much at risk. Watch the video below to learn how we are working to understand the impacts and respond to these changes.
[ Back to Top ]


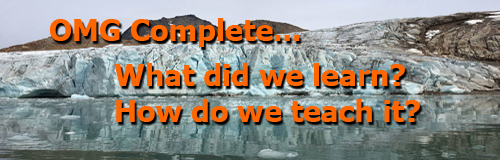
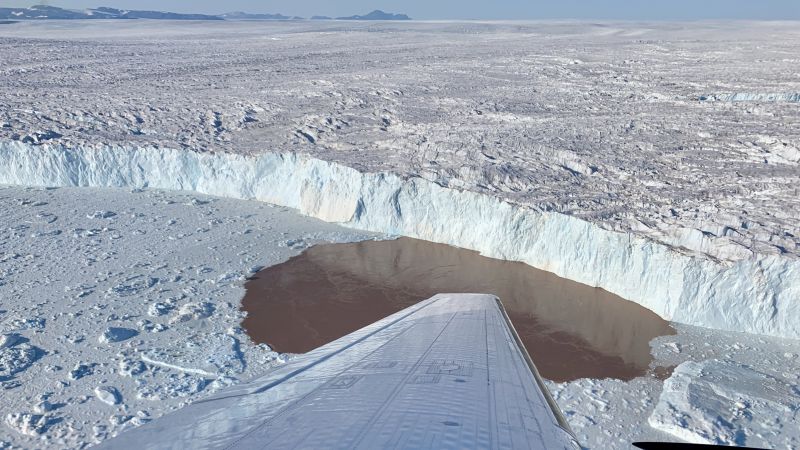
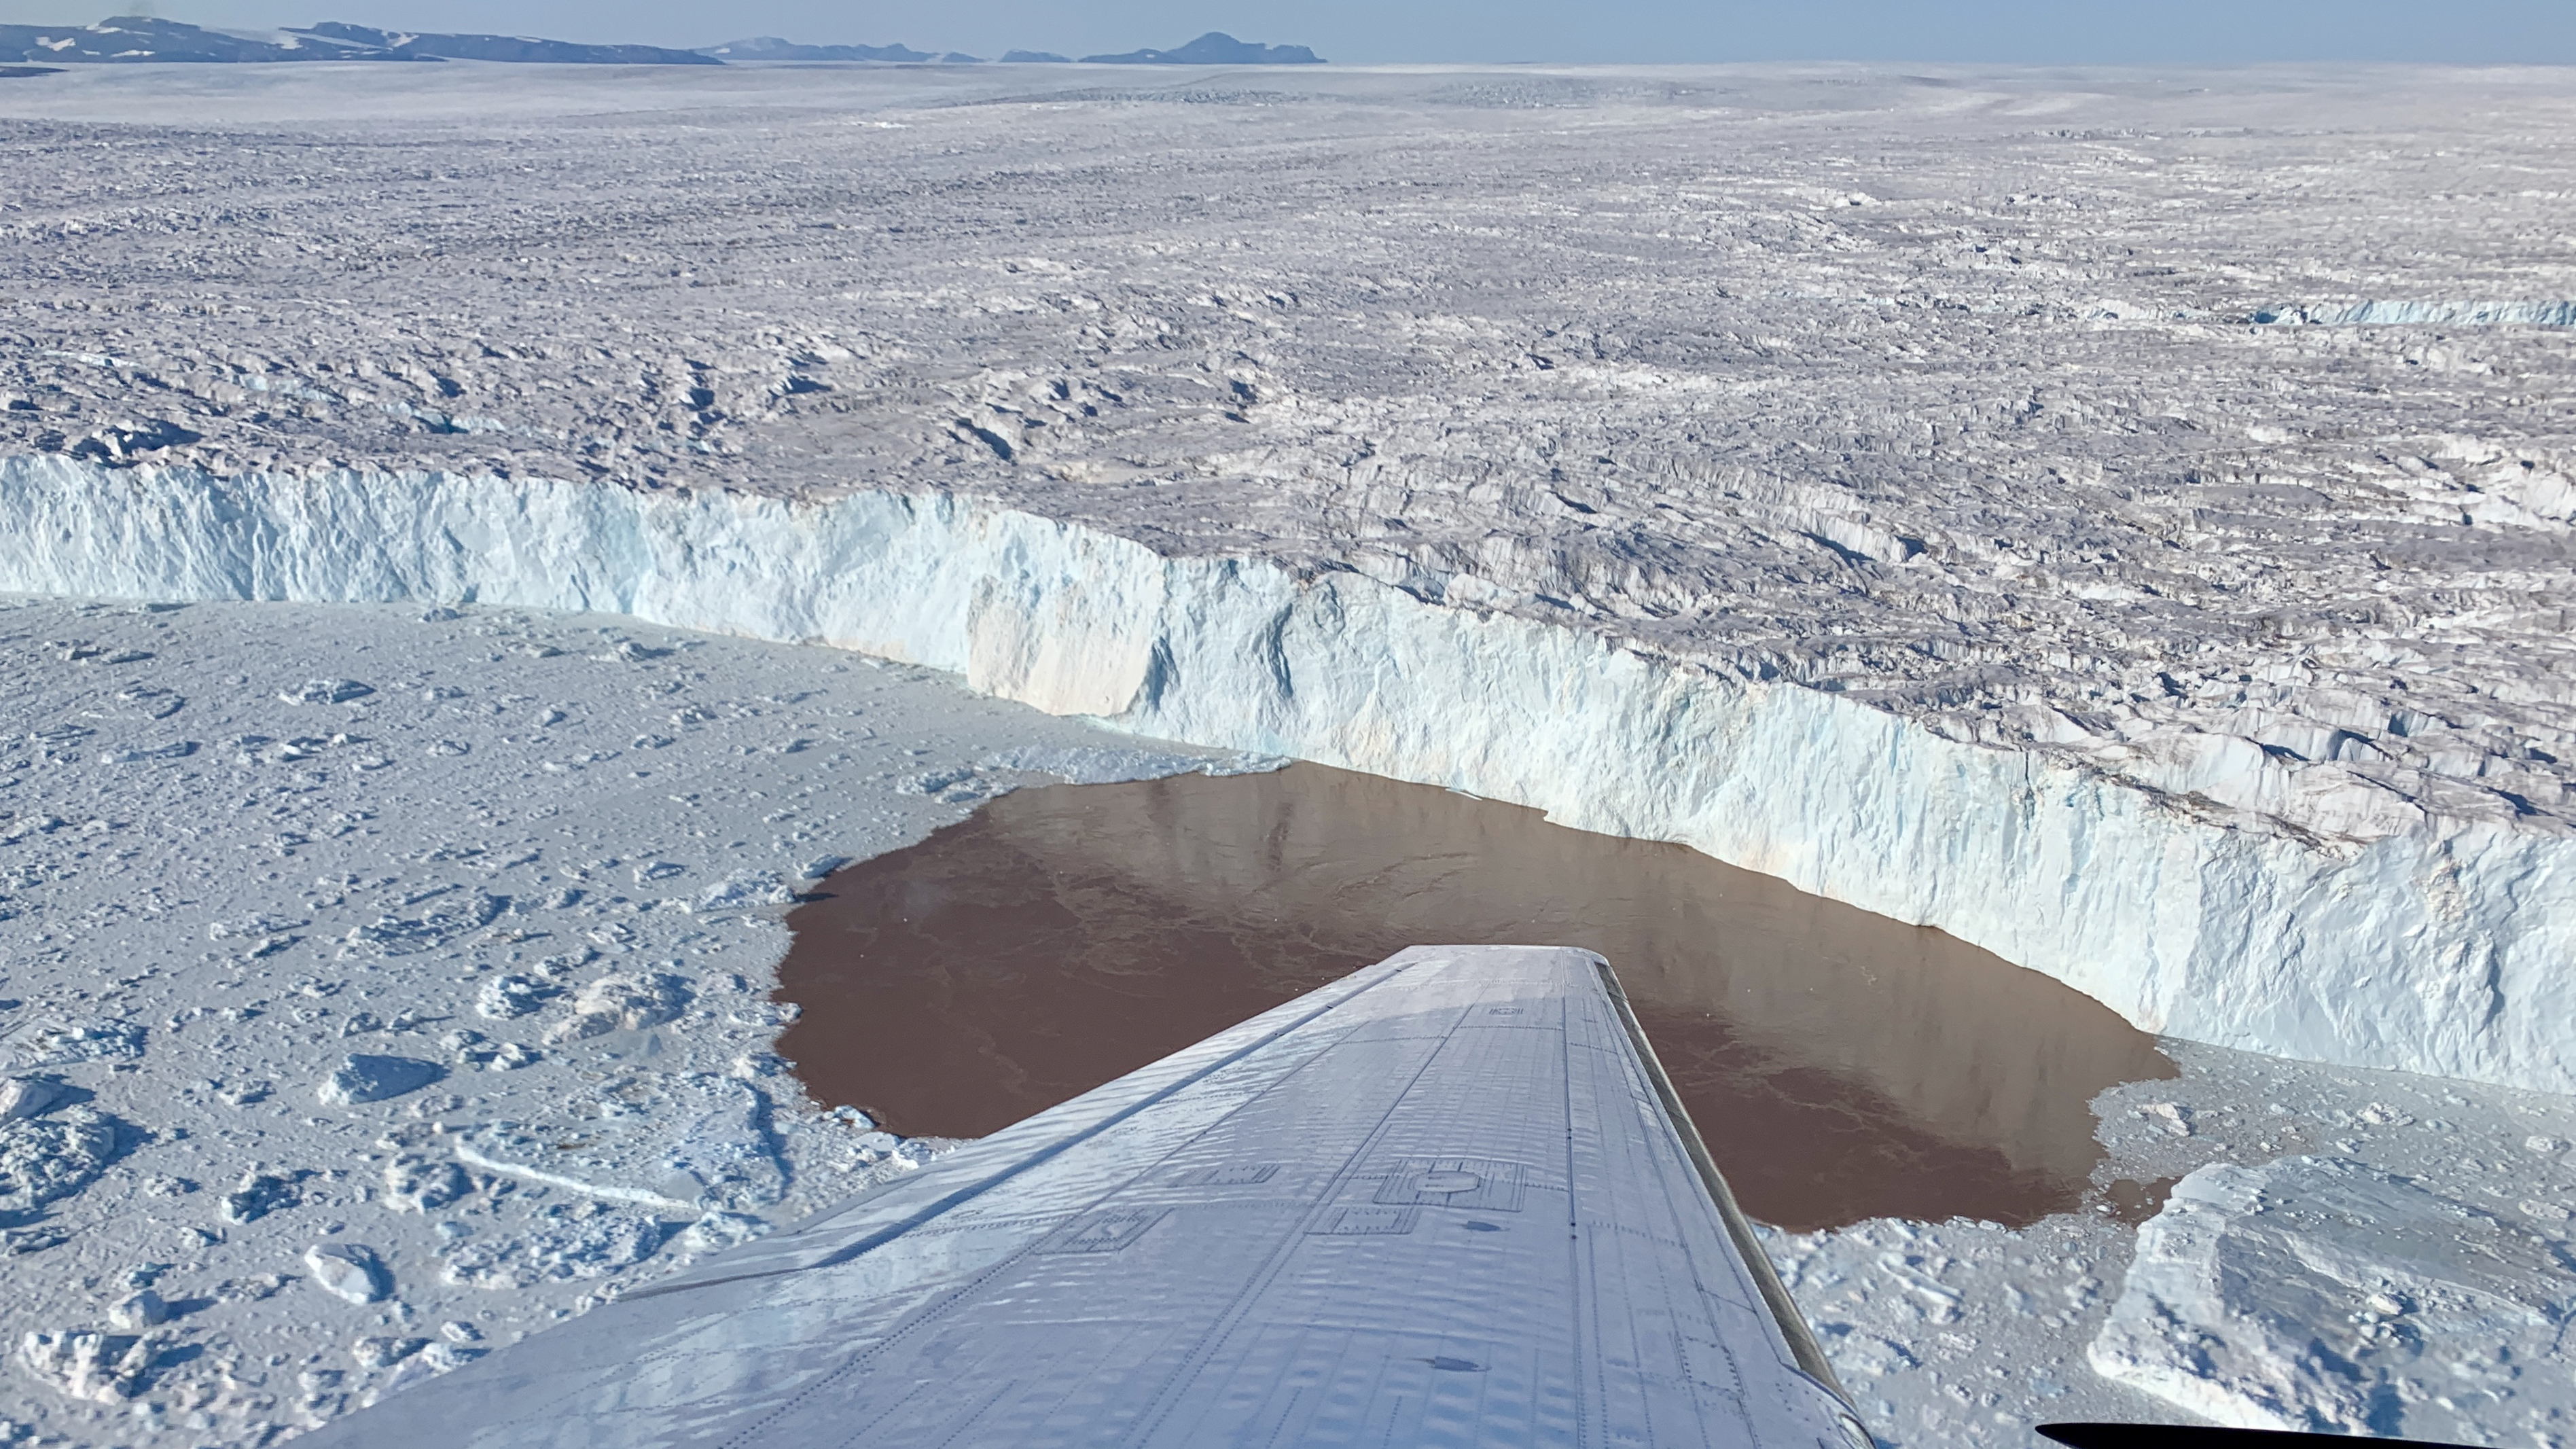
By Carol Rasmussen, NASA JPL
January 26, 20221
The most important thing to remember about NASA’s Oceans Melting Greenland mission, which ended Dec. 31, 2021, may be its name: OMG proved that ocean water is melting Greenland’s glaciers at least as much as warm air is melting them from above. Because ice loss from Greenland’s ice sheet currently contributes more to the global rise of the oceans than any other single source, this finding has revolutionized scientists’ understanding of the pace of sea level rise in the coming decades.
These new, unique measurements have clarified the likely progress of future ice loss in a place where glaciers are melting six or seven times faster today than they were only 25 years ago. If all of Greenland’s ice sheet were to melt, global sea levels would rise by about 24 feet (7.4 meters).
But that’s just the tip of the iceberg in the story of this small plane- and boat-based mission. In six years of operations, OMG made the first scientific measurements along many miles of the most remote coastline in the Northern Hemisphere. The mission performed the most complete survey of the seafloor around Greenland’s coastline, including dozens of previously uncharted fjords (cliff-lined inlets clogged with icebergs from disintegrating glaciers), and measured how the ocean temperature changed from place to place, year to year, and top to bottom. To get this unique dataset, mission planes logged enough air miles around and over Greenland to circle the globe more than 13 times.
[ Back to Top ]
By Frank Tavares, NASA Ames Research Center
February 1, 2022
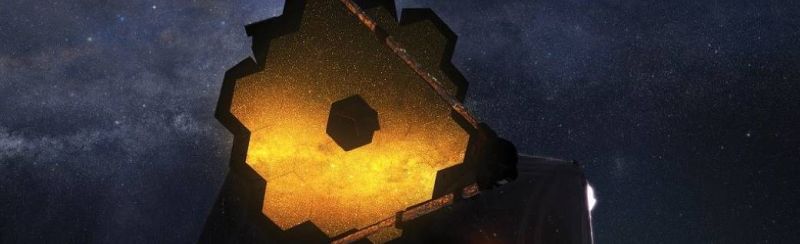
NASA's James Webb Space Telescope is getting ready to give us the best view yet of worlds beyond our own solar system, commonly known as exoplanets. Scientists at NASA's Ames Research Center in California's Silicon Valley will be among the first to observe the cosmos with Webb, and they’re looking for clues about how exoplanets form, what they're made of, and whether any could be potentially habitable.
On Jan. 24, 2022, the telescope reached its destination, an orbit about one million miles from Earth around a location called Sun-Earth Lagrange point 2, also known as L2. Now, Webb is one step closer to launching its scientific mission to transform our understanding of the universe.
When we look for exoplanets, scientists often use the worlds we know best as reference – our own, and our neighbors in the solar system. But most planets out there aren't quite like any of our neighbors.
[ Back to Top ]
By Sarah Frazier, NASA Headquarters
January 24, 2022
NASA's mission of exploration requires new technologies, software, and research – which show up in daily life. The agency’s Spinoff 2022 publication tells the stories of companies, start-ups, and entrepreneurs transforming these innovations into cutting-edge products and services that boost the economy, protect the planet, and save lives.
“The value of NASA is not confined to the cosmos but realized throughout our country – from hundreds of thousands of well-paying jobs to world-leading climate science, understanding the universe and our place within it, to technology transfers that make life easier for folks around the world,” NASA Administrator Bill Nelson said. “As we combat the coronavirus pandemic and promote environmental justice and sustainability, NASA technology is essential to address humanity’s greatest challenges.”
Spinoff 2022 features more than 45 companies using NASA technology to advance manufacturing techniques, detoxify polluted soil, improve weather forecasting, and even clean the air to slow the spread of viruses, including coronavirus.
[ Back to Top ]


By Ota Lutz
STEM Elementary and Secondary Education Specialist at NASA's Jet Propulsion Laboratory
January 24, 2022
More Lessons from the Sky is pleased to spotlight Teachable Moments from Ota Lutz at NASA JPL. This edition includes background notes like why it's important, how it was done, and what was discovered. That's followed by a Teach It section offering five complete K-12 lesson plans, two guides for student projects, and a comprehensive list of Web sites, facts & figures, videos, interactives, image galleries, articles, and a podcast to support both students and teachers in their voyage of discovery. SEA encourages all teachers (and students) to explore JPL's Teachable Moments at https://www.jpl.nasa.gov/edu/teachable-moments/.
Explore how the OMG mission discovered more about what's behind one of the largest contributors to global sea level rise. Plus, learn what it means for communities around the world and how to get students engaged.
After six years investigating the effects of warming oceans on Greenland's ice sheet, the Oceans Melting Greenland, or OMG, mission has concluded. This airborne and seaborne mission studied how our oceans are warming and determined that ocean water is melting Greenland’s glaciers as much as warm air is melting them from above.
Read on to learn more about how OMG accomplished its goals and the implications of what we learned. Then, explore educational resources to engage students in the science of this eye-opening mission.
[ Back to Top ]
Share your satellite-based lesson ideas with the teaching comunity.
Send us a full lesson plan, or simply suggest a lesson idea. If you found the idea online, please share the source as well. The lesson can be about anything that helps connect learners with satellite-based technology - any grade level K-12 - any STEM subject area or geography.
"Satellite-technology" includes any part of the science, math, engineering, or technology of satellites, rockets, and remote sensing instruments as well as the use of any environmental satellite data to explore questions related to aspects of global change and local impacts in the long term, short term, and catastrophic time frames. Of special interest are lessons providing oppotunities for learners to inquire, experiment, and apply mathematics.
Perhaps you designed a lesson yourself - we will happily prepare it for future publication in More Lessons from the Sky and inclusion in the SEA Lesson Plan Library. Perhaps you found a worthy lesson plan published elsewhere - we can research it inclusion in a lesson plan spotlight. In either case, you will receive full credit for developing and/or brining theless to the attendtion of the teaching community. Don't forget to share your insights if you tried the lesson with students.
Send your ideas to SEA.Lessons@SatEd.org.
[ Back to Top ]

![]()

This edition of the SEA Newsletter was produced in HTML5.
It is best viewed with most recent updates of Firefox, Edge, Chrome, Opera, or Safari.
©Satellite Educators Association, Inc. https://SatEd.org SEA.Newsletter@SatEd.org
Satellite Educators Association, Inc. is a 501(c)(3) non-profit educational organization.
The SEA Newsletter is published on-line monthly except January and August and available at no cost.
SEA terms, conditions, policies, ansd contact information are detailed HERE.
Unless otherwise listed, all photo and image credits are the authors of the articles.
Any opinons expressed in this Newsletter are those of the authors
and not necessarily those of the Satellite Educators Association, Inc.
Many SEA Newsletter items contain third-party links to sites not governed by Satellite
Educators Association, Inc. The viewer is cautioned to be aware of the terms of use and
privacy policies for those third-party sites.![]()