

OUR VISION
The world's finest educators supporting science, technology, engineering, and math (STEM) learning for pre-kindergarten to post-graduate students using real-world applications from satellites and satellite data.
OUR MISSION
To enhance the education environment to excite students about science, technology, engineering, and math through space-based technology -- satellites and satellite data.

Martin Luther King III

When there's water on Earth, you find life as we know it. So if you find water somewhere else, it becomes a remarkable draw to look closer to see if life of any kind is there, even it it's bacterial, which would be extraordinary for the field of biology.
Neil deGrasse Tyson

TABLE OF CONTENTS
Click a RED link to view article
Association News
Input from Ron
John's Journey
Satellites with Ed
M.Y. S.P.A.C.E. News
News from NOAA
News from NASA
More Lessons
from the Sky
Go to SEA Home Page

Mark your calendars now for the 35th annual Satellites & Education Conference to be held Friday-Saturday, July 29-30, 2022 at California State University, Los Angeles. This outstanding event for teachers has been offered each and every year since 1988. From 1988-2001, the conference was held at West Chester University in Pennsylvania. The conference has been hosted by Cal State LA since 2002. This year, the conference will feature a hybrid format where registered attendees will be welcomed in-person as well as on ZOOM. Plans for the conference are underway.
Teachers attending the Satellites & Education Conference continuously report this is the best conference they ever attended. It is rare to find such a rich community of scientists and engineers from aerospace, NOAA, NASA, USGS, and university researchers interfacing so supportively with educators!
Would you like to be part of the planning for this magnificent conference? You can - by participating in the next SEA members meeting on Saturday March 12, 2022. The meeting will start at 10AM PST. All "Active" members are welcome. To renew your membership to Active status or join SEA for the first time, click HERE or visit https://SatEd.org and click the Join Us button.

[ Back to Top ]
Start planning now! Satellites & Education Conference XXXV, July 29-30, 2022, needs presenters and exhibitors for both the face-to-face conference at Cal State LA and on ZOOM!
Presenters can submit presentation proposals and exhibitors can request exhibit space -- all online starting the first of April. Detailed information about benefits for presenters and exhibitors, co-presenters, facilities, handout distribution, and more will all be available online at that time.
Visit https://SatEd.org soon for more information.
[ Back to Top ]
Members of the Satellite Educators Association will meet again on ZOOM Saturday, March 12, 2022 starting at about 10AM PST. Important issues about Satellites & Education Conference XXXV will decided. Don't miss this chance to give input and hear what's happening!
The SEA membership met on February 12 to continue the disucssion of the future of the Association and, in particular, the Satellites & Education Conference. Led by President Monica Maynard, the gathered members reported potential new resources and confirmed Conference XXXV will be offered in hybrid format on July 29-30, 2022, both in person at California State University, Los Angeles and on ZOOM.
This year's conference will be hosted by the Charter College of Education at California State University, Los Angeles and supported by NASA, NOAA, and aerospace leaders like Raytheon. Conference registration, call for session proposals, and requests for exhibit space are expected to open online the first of April. More information will become available at and after the Marchy 12, 2022 meeting.
The conversation will continue on March 12 at which time many conference details will be finalized.
This will serve as official notice that the Satellite Educators Association, Inc. calls a meeting of its membership on Saturday, March 12, 2022, starting at 10AM PST. Two hours have been blocked out for the meeting, but conversations could continue longer if needed. Active members will receive ZOOM login directions by e-mail during the week preceeding March 12.
To particpate in the meeting, membership must be "Active" (dues paid through July 31, 2022). To renew your membership, join SEA for the first time, or just check your membership status, click HERE or visit https://SatEd.org and click the Join Us button.
[ Back to Top ]


By Ron Gird, Meteorologist and former Satellite/Spaceflight and Outreach Program Manager for the National Weather Service
This article from Discover is based on a episode of the podcast, Citizen Science: Stories of Science We Can Do Together! In it, co-host Bob Hirshon and Carline Nickerson discuss some of the inspiring citizen science work conducted under the auspices of NOAA. Enjoy
By Bob Hirshon, Discover (https://www.discovermagazine.com/environment/exploring-earth-with-noaa-citizen-science)
February 1, 2022
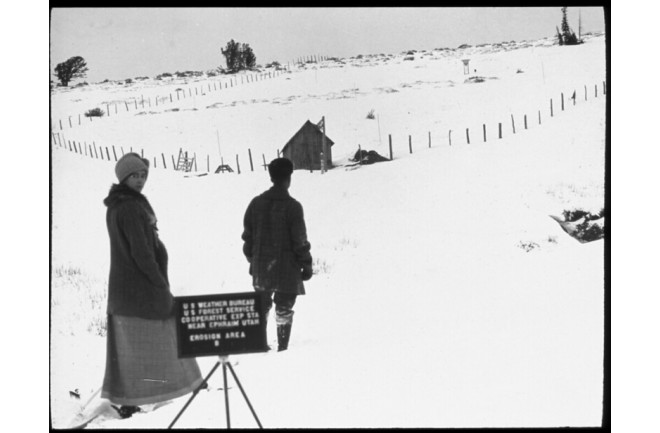
The National Weather Service (NWS) was doing citizen science before citizen science was cool. Back in 1890, NWS launched its Cooperative Observer Program, with weather data collected via telegraph from farmers and other volunteer weather observers across the country. And that work was predated by noted citizen scientists like Thomas Jefferson and George Washington, who diligently collected and shared weather data a hundred years earlier.
Today, NWS operates under the auspices of the National Oceanic and Atmospheric Administration (NOAA) and is just one part of an enormous network of physical science programs that include 41 active citizen science programs. They support research efforts not only in weather, but also in tracking marine debris, protecting endangered species, monitoring climate change, mapping Earth's magnetic field and other areas of scientific study pertaining to the planet's air and water.
[ Back to Top ]


By John D. Moore, Executive Director, Institute for Earth Obervations at Palmyra Cove, New Jersey
Work on the A3Sat Project continues to evolve with new developments after feedback from the pilot test group. Once the engineering, design, and construction phases ended we began to consider how the CubeSat model might communicate with a ground station. Our Cube's original design called for storing all imagery and data onboard for later retrieval through its USB port. It was felt this procedure was not truly realistic especially since a CubeSat in space would not be able to return to the Earth’s surface for data retrieval. Sriram Elango took on the task of developing a software product that would be able to communicate with the A3Sat and download imagery and data to a “ground station.” Sriram completely designed the user interface and completed all necessary coding to add such a remote data retrieval system to this project.
Sriram entered his work in the Congressional App Challenge Program.
The Congressional App Challenge is an official initiative of the U.S. House of Representatives where Members of Congress host contests in their districts for middle and high school students, encouraging them to learn to code and inspiring them to pursue careers in computer science.
Rep. Andy Kim has named Sriram Elango from Cinnaminson High School, and student research assistant at the Institute for Earth Observations, as the winner of the 2021 Congressional App Challenge for New Jersey’s Third District.
When asked what inspired the creation of a ground station, the student said, "As a result of technology not being prevalent within my school, as well as my environment underestimating the capabilities of students, I ventured outwards to explore more fields and research areas that I could further work on! In doing so, I was able to begin conducting research at the Institute for Earth Observations, which was developing a cube satellite to provide to schools across New Jersey for students to become more engaged with high-level technology."
As a result, Sriram will now represent Rep. Kim in the national level challenge, HOUSEOFCODE. This new National Science Fair will be held virtually April 20-22, 2022. You can see Sriram’s three-minute video description of the project and learn more about the Congressional App Challenge at https://www.congressionalappchallenge.us/21-nj03/.
Currently, Sriram is expanding on the capabilities of the app to include analysis products thus enhancing the “Analyze” portion of the A3Sat Project. This supplemental work will include other ground-based data that will be observed, measured, and collected using the “GLOBE Observer App” which steps investigators through making cloud, tree, mosquitoes, and land cover observations from ground level.
Remember, the GLOBE Observer topics are used in NASA/GLOBE projects that supply data and imagery to NASA researchers associated with earth observing satellites such as ICESat2, GPM, GOES-S, GOES-T (scheduled to launch today, March 1), CLOUD Sat and others. For teachers, GLOBE Observer and A3Sat are well aligned with the Space to Earth: Earth to Space (SESS) instructional strategy mention in earlier John’s Journey articles.
NASA GLOBE Mission Earth’s “Students Designing CubeSats in the A3Sat Project “webinar was held on February 25, 2022. This will be posted online shortly. In this webinar you can meet and hear directly from Max, Sriram, Kaleb, and Aidan (the student design team) about how and why they, as students, joined the project and the experiences gained from working on the A3Sat Project.
We are all very proud of Sriram. I truly appreciate all of his hard work and dedication to the project.
The idea that high school students, and even middle school students, can accomplish such tasks and research at a precollege level demonstrates that students can accomplish much more than what is expected of them in the classroom. Over many years SEA members attending the Satellites & Education Conference witnessed the M.Y.S.P.A.C.E student teams working together during the conference, that work culminating in an inspiring closing conference presentation. There has been significant research relating to the value of afterschool programs providing deeper instructional experiences into subjects of high student interest but not necessarily taught in the traditional school setting. Working on projects such as this allows students to develop and practice authentic STEM skills with authentic applications. The workforce development skills learned through this type of CTE-based instruction not only prepare students for their future, but expose them to opportunities generally not found in K-12 curricula. Students can “Observe the Earth and Visualize their Future" (to paraphrase my own quotation).
Remember - “you can teach anything with satellites”.
Stay safe - stay well!
For now, I'm John...and this is my journey.
[ Back to Top ]

By Edward Murashie, President, Proengineered Solutions
With the lowest priced SoFi Stadium nosebleed tickets for the Super Bowl game costing $4400, and parking costing $6000, you could have opted instead for less expensive view from Landsat 9, albeit from 705 kilometers (438 miles) above the stadium.
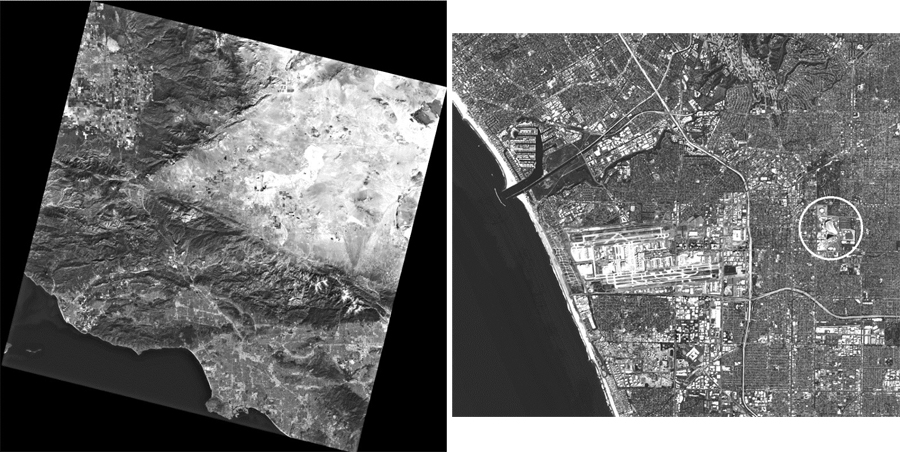
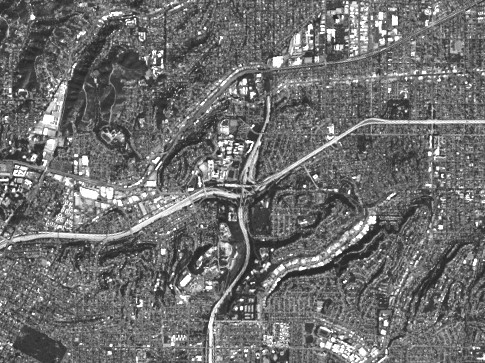
Image 1 below was captured by Landsat 9 on February 13 over Los Angeles California and was downloaded easier than you would have thought. The whole process is just a few mouse clicks and is explained in this article. The image skew is due to the satellite’s orbital inclination and the Earth’s rotation. Image 2 below is Image 1 is zoomed in to where you can see each image pixel, taking advantage of the imager’s panchromatic 15 meters (about 49 feet) resolution. Los Angeles International Airport is to the left of SoFi Stadium and the north-south running I405 Freeway.
What makes the Landsat series of satellites unique is that at least one Landsat has been operating for nearly 50 years, with Landsat 1 launched on July 23, 1972. Landsat 1 carried two imagers, the return beam vidicon (RBV) and the multispectral scanner (MSS). The MSS had 4 wavelength channels, each were capable of 64 levels of gray scale, 79 meters (259 feet) ground resolution and a swath width of 185 kilometers (115 miles). Each succeeding Landsat satellite added more wavelength channels, improved the number of gray scale levels and the ground resolution. However, each Landsat has kept the same basic wavelength channels and swath width so that imagery could be compared. Landsat 9, the latest Landsat satellite launched on September 27, 2021, carries the second-generation Operational Land Imager 2. It has 9 wavelength channels, each with 4096 levels of gray scale, a swath width of 185 kilometers, and 30 meters (98 feet) ground resolution except for the panchromatic Band 8 with 15 meters (49 feet) resolution.
What makes the Landsat series of satellites unique is that at least one Landsat has been operating for nearly 50 years, with Landsat 1 launched on July 23, 1972. Landsat 1 carried two imagers, the return beam vidicon (RBV) and the multispectral scanner (MSS). The MSS had 4 wavelength channels, each were capable of 64 levels of gray scale, 79 meters (259 feet) ground resolution and a swath width of 185 kilometers (115 miles). Each succeeding Landsat satellite added more wavelength channels, improved the number of gray scale levels and the ground resolution. However, each Landsat has kept the same basic wavelength channels and swath width so that imagery could be compared. Landsat 9, the latest Landsat satellite launched on September 27, 2021, carries the second-generation Operational Land Imager 2. It has 9 wavelength channels, each with 4096 levels of gray scale, a swath width of 185 kilometers, and 30 meters (98 feet) ground resolution except for the panchromatic Band 8 with 15 meters (49 feet) resolution.
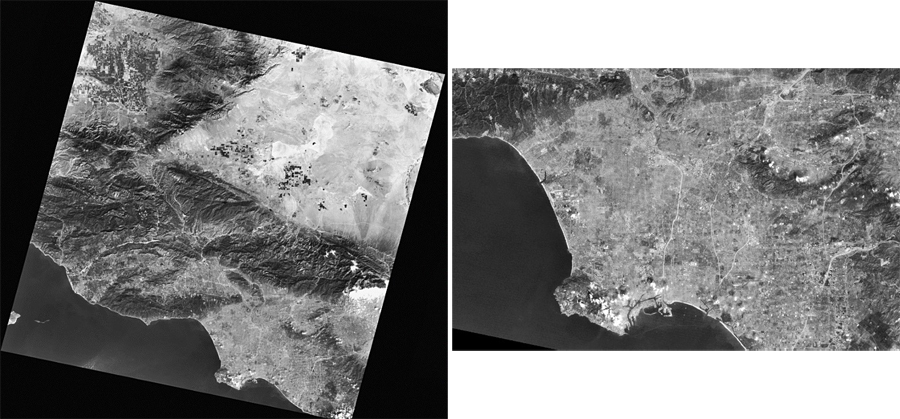
Image 3 below is a Landsat 1 MSS image taken on October 21, 1972 and Image 4 below is the same image but zoomed in so each screen pixel corresponds to an image pixel representing 79 meters on the ground. The vertical lines in the image are not freeways like you see in Image 2, but the flood channels of the Los Angeles River (left of center) and the San Gabriel River (right of center).
And in case you were wondering what California State University, Los Angeles looks like, the site of this year’s Satellites & Education Conference, look closely at Image 5. It is Image 1 zoomed in. Cal State LA occupies the northwest quadrant of the intersection of the east-west I10 and the north-south I710 freeways. Can you find it?
By act of Congress, from 1984 all Landsat imagery was distributed by Earth Observation Satellite Company (EOSAT) at a price of $200 to $4000 per image. Because of high cost, the use of Landsat products declined sharply until Congress acted again in 1992, this time returning program operation to the government. By 2008, the Unites States Geologic Survey (USGS) had a fully operational archive with free access to all Landsat imagery. Not unexpectedly, data usage skyrocketed. You can find out more about this history at https://www.nasa.gov/mission_pages/landsat/news/landsat-history.html.
Today you can register for free and download the images at no cost on USGS sites such as EarthExplorer at https://earthexplorer.usgs.gov/ and GloVis at https://glovis.usgs.gov/app. (See the GloVis lesson plan in More Lessons From the Sky in this SEA Newsletter issue.)
Let's look at Earth Explorer for an example of how easy it is to obtain Landsat imagery. To use EarthExplorer, go to the site and register. Once registered, simply follow these steps:
Now that you have browsed a few images, you can learn more about the Landsats, their benefits and how scientists study the images, by visiting USGS Landsat Missions at https://www.usgs.gov/landsat-missions and NASA’s Landsat Science at https://landsat.gsfc.nasa.gov/. Have fun with everything Landsat offers whether just viewing the images, using them in your own research project, or teaching your class. And remember, the Satellite Educators Association is here to be of assistance.
[ Back to Top ]


A National Public Radio interview by Jeffrey Pierre
January 7, 2022
Louis Uccellini retired at the beginning of [January 2022] as director of the National Weather Service, the federal agency responsible for issuing forecasts and warnings. His departure ends a nine-year tenure when the weather – especially extreme weather – began upending the lives of greater numbers of Americans.
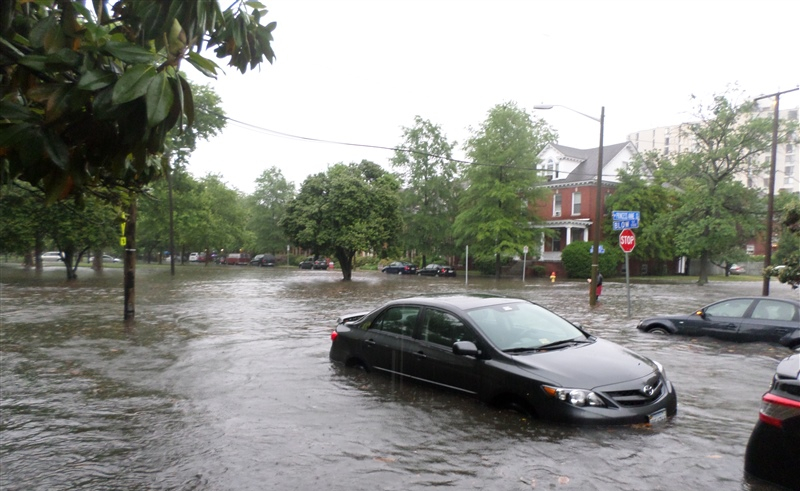
Winter storms set records in the Pacific Northwest for snow and low temperatures recently. Throughout 2021, the country saw record flooding in the Northeast, and heatwaves in the West. And on the front line of every event has been the National Weather Service (NWS).
Uccellini spent a great deal of his time as director on improving technology at the weather service. But the agency's biggest challenge is effective messaging about the weather, especially extreme events, Uccellini says.
Even now, people don't really understand what forecasts are telling them.
"People often want us to tell them it's going to rain in your backyard over your tomato plant at 5:20 p.m. We can't give that precision of information," says Marshall Shepherd, the head of the atmospheric sciences program at the University of Georgia. "The atmosphere is just a nonlinear, complex, fluid system that you're trying to predict. It's basically like trying to take a beach ball up in Minnesota, putting it in the Mississippi River, and trying to predict exactly where that beach ball is going to be downstream in three to five days."
Shepherd says these kinds of misconceptions fuel doubt within the public. As a result, people often ignore forecasts about serious weather threats and fail to get out of harm's way in time, Uccellini says.
The NWS has made a lot of progress on communication under Uccellini, especially as climate change makes weather more extreme, says Brenda Ekwurzel, director of climate science for the Climate & Energy Program at the Union of Concerned Scientists. Simple changes like telling people to seek shelter instead of sending a warning in all capital letters have made the difference, she says.
But Ekwurzel says the NWS is underfunded, despite its critical mission. Its total budget in 2021 was $1.2 billion.
"They literally have saved lives on a scale that is underappreciated because a life saved – we don't have those numbers, right?" Ekwurzel says.
In a wide-ranging conversation, Uccellini spoke about how factors like climate change and messaging have forced the agency, the backbone of the weather industry, to change how it does its job.
[ Back to Top ]

From NOAA News & Features
February 15, 2022
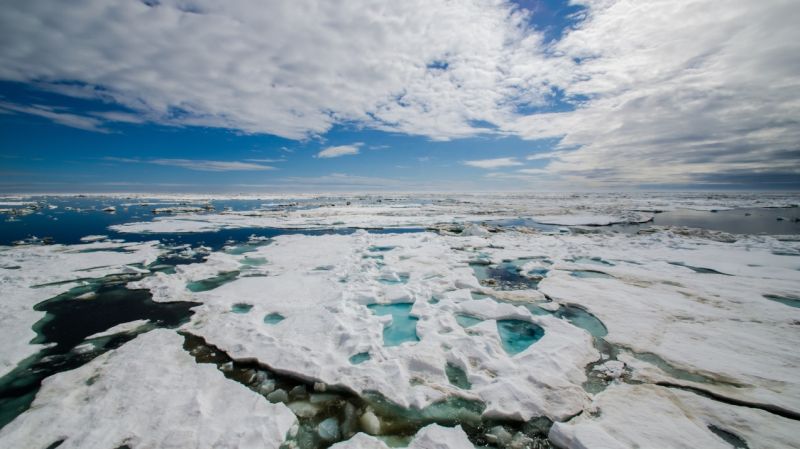
The United States is expected to experience as much sea level rise by the year 2050 as it witnessed in the previous hundred years. That’s according to a NOAA-led report updating sea level rise decision-support information for the U.S. released today in partnership with half a dozen other federal agencies.
The Sea Level Rise Technical Report provides the most up-to-date sea level rise projections for all U.S. states and territories by decade for the next 100 years and beyond, based on a combination of tide gauge and satellite observations and all the model ensembles from the Sixth Assessment Report of the Intergovernmental Panel on Climate Change (IPCC). The report projects sea levels along the coastline will rise an additional 10-12 inches by 2050 with specific amounts varying regionally, mainly due to land height changes.
The report updates the federal government’s 2017 sea level rise projections, and provides additional information on tide, wind, and storm-driven extreme water levels affecting current and future coastal flood risk. A suite of federal tools are using this data, including the NOAA Sea Level Rise Viewer, which are critical to the Administration’s commitment to tackle the climate crisis by making actionable climate data accessible to those who need it.
[ Back to Top ]
From National Weather Service
February 15, 2022
In response to feedback from emergency managers and others, the National Weather Service (NWS) has made changes to how it provides weather radar data to the public. In addition to significant performance improvements to the Enhanced Radar GIS-based website for seasoned users who want dozens of radar products, the NWS developed a simplified fast loading radar website called Local Standard Radar.
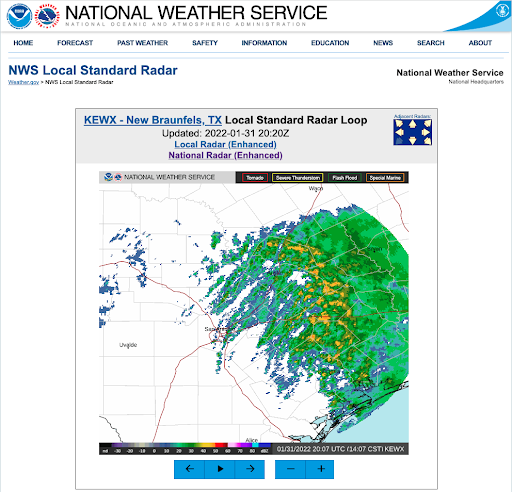
Local Standard Radar provides low bandwidth users a reliable, fast loading website for radar images, radar loops, and warning polygons in effect (Tornado, Severe Thunderstorm, Flash Flood, and Snow Squall Warnings). The new site offers base reflectivity only and defaults to the most recent loop (10 frames; last 45 minutes) from any individual WSR-88D radar. Radar loops and images are automatically updated every five minutes.
[ Back to Top ]
From NOAA News &amo; Features
February 24, 2022
This week some 270 top scientists from 67 countries, including two NOAA scientists, are completing the final details of a large-scale report: Climate Change 2022: Impacts, Adaptation & Vulnerability, the second part of the Sixth Assessment Report offsite link. The report will describe how climate change is already affecting the world’s human and natural systems.
On Monday, February 28, the United Nations Intergovernmental Panel on Climate Change offsite link (IPCC) will release its latest report, which will focus on climate solutions and regional and local adaptation. It will also assess the feasibility of various adaptation strategies to curb current and predicted impacts of climate change.
The IPCC was established 34 years ago to provide actionable information on climate change for decision makers. IPCC reports are the result of a unique collaboration of scientific expertise and political consensus. The new report will reaffirm that the science pertaining to climate change is settled, and the most important response to climate change is large-scale reduction in carbon dioxide pollution that drives global warming.
To learn more about why this new report matters and what went into creating it, NOAA interviewed NOAA authors, Libby Jewett, director of the NOAA’s Ocean Acidification Program, and Kirstin Holsman, a research scientist from NOAA’s Alaska Fisheries Science Center. They served on an international team of authors who assessed scientific literature to prepare the new IPCC report’s chapter on North America.
[ Back to Top ]


By Carol Rasmussen, NASA JPL
February 8, 2022
After being installed on the International Space Station, two small instruments designed and built at NASA’s Jet Propulsion Laboratory in Southern California were powered up Jan. 7 and began collecting data on Earth’s ocean winds and atmospheric water vapor – critical information required for weather and marine forecasts. Within two days, the Compact Ocean Wind Vector Radiometer (COWVR) and Temporal Experiment for Storms and Tropical Systems (TEMPEST) instruments had gathered enough data to begin producing maps.
COWVR and TEMPEST launched on Dec. 21, 2021, with SpaceX’s 24th commercial resupply mission for NASA. Both instruments are microwave radiometers, measuring variations in natural microwave emissions from Earth. Part of the U.S. Space Force’s Space Test Program-Houston 8 (STP-H8), the instruments were designed to demonstrate that they can collect data comparable in quality to the larger instruments currently operating in orbit.
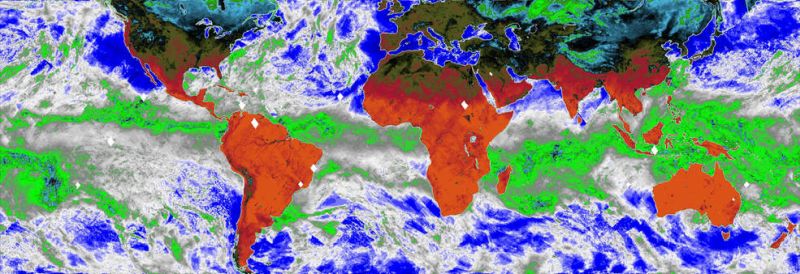
This new map from COWVR shows microwave emissions from Earth at 34 gigahertz through all latitudes visible to the space station (52 degrees north to 52 degrees south). This particular microwave frequency provides weather forecasters information on the strength of winds at the ocean surface, the amount of water in clouds, and the amount of water vapor in the atmosphere.
Green and white on the map indicate higher water vapor and clouds, while dark blue over the ocean indicates drier air and clear sky. The image captures typical weather patterns, such as tropical moisture and rain (the green band stretching across center of map) and mid-latitude storms moving across the ocean.
"We’re off to a great start,” said Shannon Brown, the JPL technologist who designed the COWVR instrument. “Seeing this quality of data so early into the mission sets the stage for very exciting things to come.”
COWVR is a complete rethinking of a classic instrument design, while TEMPEST is the product of a long advance toward miniaturizing instrument components. If they continue to prove successful, they will crack open the door to a new era where lower-cost satellites complement the existing weather satellite fleet.
[ Back to Top ]
By Jane J. Lee and Ian J. O'Neill, NASA JPL
November 17, 2021
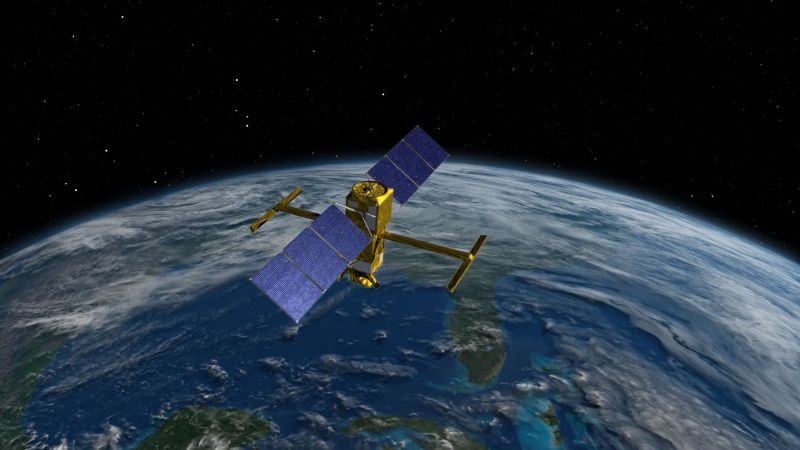
An international team of engineers and technicians has finished assembling a next-generation satellite that will make the first global survey of Earth’s surface water and study fine-scale ocean currents. The Surface Water and Ocean Topography (SWOT) mission is just a year out from launch, and the final set of tests on the spacecraft have started.
SWOT is a collaboration between NASA and the French space agency Centre National d’Etudes Spatiales (CNES), with contributions from the Canadian Space Agency (CSA) and the United Kingdom Space Agency (UK Space Agency). The SUV-size satellite will collect data on the height of Earth’s salt- and fresh water – including oceans, lakes, and rivers – enabling researchers to track the volume and location of water around the world.
SWOT will help to measure the effects of climate change on the planet’s water, such as the processes by which small, swirling ocean currents absorb excess heat, moisture, and greenhouse gases like carbon dioxide from the atmosphere. The mission’s measurements will also aid in following how much water flows into and out of the planet’s lakes, rivers, and reservoirs, as well as regional shifts in sea level.
“SWOT will be our first global snapshot of all surface water that we have now, how the water moves around the planet, and what happens to it in a new climate,” said Nadya Vinogradova Shiffer, SWOT program scientist at NASA Headquarters in Washington.
A team at the agency’s Jet Propulsion Laboratory in Southern California shipped the scientific heart of the satellite to Cannes, France, in June. Ever since, they’ve been working with colleagues from CNES and the French space agency’s contractor, Thales Alenia Space, to connect the part of the spacecraft holding the science instruments to the rest of the satellite and ensure that the electrical connections function properly.
“The best part has been seeing two complex systems that were built across the world from each other by different teams come together and work,” said JPL’s Said Kaki, the deputy project manager for SWOT. Kaki, along with an initial team of about 25 people from JPL, followed the mission’s science instruments to France in June. There are certain tests and procedures that the team needs to conduct in person, so they are living and working thousands of miles from home until the SWOT satellite is shipped to its launch site at Vandenberg Space Force Base in Central California in September 2022.
[ Back to Top ]
By Greg Taylor, NASA's Earth Science Technology Office
February 25, 2022
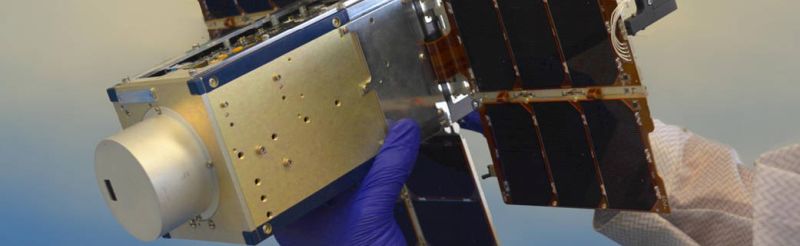
NASA is launching a prototype instrument that could make it easier to monitor volcanic activity and air quality. Perched aboard a CubeSat about 300 miles (480 kilometers) above Earth’s surface, the “Nanosat Atmospheric Chemistry Hyperspectral Observation System,” or NACHOS, will use a compact hyperspectral imager to locate sources of trace gases in areas as small as 0.15 square miles (0.4 square kilometers) – about the size of the Mall of America in Minnesota. NACHOS is part of Northrop Grumman’s 17th resupply mission to the International Space Station from NASA’s Wallops Flight Facility on Wallops Island, Virginia.
If successful, NACHOS will be the smallest, highest resolution space-based instrument dedicated to monitoring atmospheric trace gases like sulfur dioxide (SO2) and nitrogen dioxide, paving the way for future Earth-observing systems that will not only help predict volcanic eruptions, but also monitor air quality around specific cities, neighborhoods, and even individual power plants.
“A dormant volcano just waking up may emit SO2 before there is any detectable seismic activity. That gives us a chance to identify a potentially erupting volcano before it actually blows,” said Steve Love, a researcher and task lead with the Space and Remote Sensing Group at the Department of Energy’s Los Alamos National Laboratory (LANL).
Atmospheric trace gases from natural and human-made sources provide scientists with unique insights into a wide variety of Earth systems. For example, nitrogen dioxide, often produced by burning fossil fuels, negatively impacts human health and can serve as a tracer for carbon dioxide (a greenhouse gas that contributes to climate change) that results from human activity.
“When we recognize that these gases are present and can localize their sources on a sub-kilometer scale, we have the opportunity to take action and minimize negative health outcomes,” said Love.
But monitoring trace gases requires instruments sensitive enough to gather high-resolution data; traditionally, that’s meant creating larger satellites equipped with a full suite of powerful sensors.
[ Back to Top ]


From NOAA Boulder
January 29, 2022
On December 30, 2021, a combination of long-term drought and hurricane-force winds set the stage for what would become the most destructive fire in Colorado history in terms of property loss. Driven by ferocious winds, a grass fire quickly advanced from the outskirts of Boulder on the neighboring cities of Louisville and Superior. Horrified residents had little time to evacuate as the wildland fire transformed into an urban firestorm. This story recounts the events of that day from the perspective of NOAA's National Weather Service meteorologists who sent the first high-wind warnings in the hours before dawn, and continued to alert residents throughout the day as the worst-case scenario unfolded.
This amazing ArcGIS storymap was created by NOAA using satellite imagery, ground-level still and motion pictures, data analysis, graphs and charts. It presents the story of the Marshall Fire in these sections: Early Warning, Tragdey Strikes, A Vital Source of Information, What's Left Behind, and Preparing for Future Fires.
[ Back to Top ]
From NOAA News & Featurese
January 31, 2022
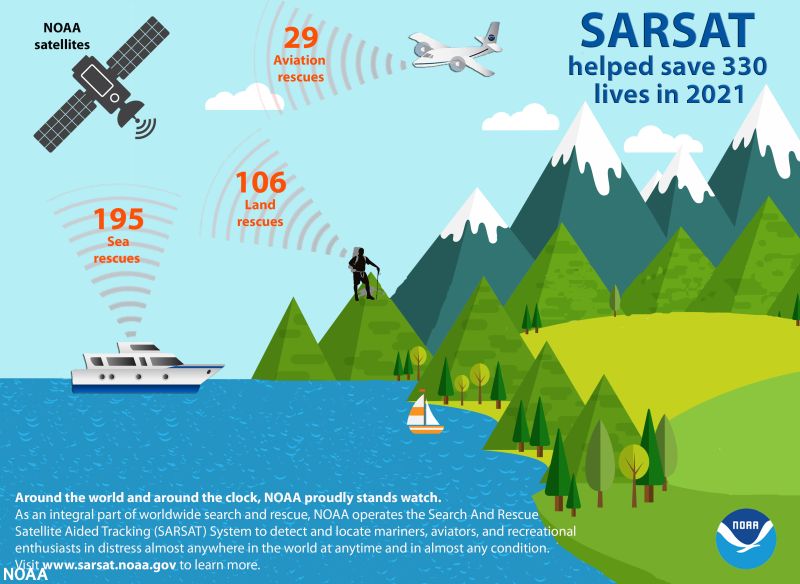
NOAA’s fleet of advanced satellites are essential for predicting weather and climate, and last year they also helped rescue 330 people from potentially life-threatening situations throughout the United States and its surrounding waters.
Of the 330 U.S. rescues, 195 were water rescues, 29 were from aviation incidents and 106 were from events on land. Alaska had the most SARSAT rescues with 55, followed by Florida with 52 and California with 37.
NOAA’s polar-orbiting and geostationary satellites are part of the global Search and Rescue Satellite Aided Tracking system, or COSPAS-SARSAT, which uses a network of U.S. and international spacecraft to detect and locate distress signals sent from emergency beacons from aircraft, boats and handheld Personal Locator Beacons (PLBs) anywhere in the world. Since its start in 1982, COSPAS-SARSAT has been credited with supporting more than 48,000 rescues worldwide, including more than 9,700 in the United States and its surrounding waters.
When a NOAA satellite pinpoints the location of a distress signal in the U.S., the information is relayed to the SARSAT Mission Control Center at NOAA’s Satellite Operations Facility in Suitland, Maryland. From there, the information is sent quickly to Rescue Coordination Centers, operated either by the U.S. Air Force for land rescues, or the U.S. Coast Guard for water rescues. NOAA also supports rescues globally by relaying distress signal information to international SARSAT partners.
[ Back to Top ]


Since artificial satellites first orbited Earth in 1956, scientists, both amateur and professional, have collected and studied the vast amounts of observations made by, and transmitted to us, from sensors on those satellites. Most of these data are archived in databases that have been used only by expert investigators trained in the use of specialized retrieval techniques and analysis tools.
More recently, the National Aeronautics and Space Administration (NASA), the National Oceanic and Atmospheric Administration (NOAA), and the U.S. Geological Survey (USGS), among others, have developed online tools for easy retrieval of archived data in various forms that serve the needs of every level of scientific research including middle and high school grade levels.
This hands-on tutorial guide is an introduction to GloVis, the USGS Global Visualization Viewer (GloVis), a quick and easy online search tool for selected satellite and aerial data. GloVis provides access to imagery from aerial surveys, EO-1, and Landsat satellites among others. Following the tutorial steps, learners will experience the value and utility of GloVis for themselves while becoming familiar with its "look and feel" as they investigate changes in Greenland's Jacobshavn Glacier.
| Grade Level: | 6-12 |
| Time Requirement: | 1-2 class periods |
| Prerequisites: | None |
| Relevant Disciplines: | All |
[ Back to Top ]
Share your satellite-based lesson ideas with the teaching comunity.
Send us a full lesson plan, or simply suggest a lesson idea. If you found the idea online, please share the source as well. The lesson can be about anything that helps connect learners with satellite-based technology - any grade level K-12 - any STEM subject area or geography.
"Satellite-technology" includes any part of the science, math, engineering, or technology of satellites, rockets, and remote sensing instruments as well as the use of any environmental satellite data to explore questions related to aspects of global change and local impacts in the long term, short term, and catastrophic time frames. Of special interest are lessons providing oppotunities for learners to inquire, experiment, and apply mathematics.
Perhaps you designed a lesson yourself - we will happily prepare it for future publication in More Lessons from the Sky and inclusion in the SEA Lesson Plan Library. Perhaps you found a worthy lesson plan published elsewhere - we can research it inclusion in a lesson plan spotlight. In either case, you will receive full credit for developing and/or brining theless to the attendtion of the teaching community. Don't forget to share your insights if you tried the lesson with students.
Send your ideas to SEA.Lessons@SatEd.org.
[ Back to Top ]

![]()

This edition of the SEA Newsletter was produced in HTML5.
It is best viewed with most recent updates of Firefox, Edge, Chrome, Opera, or Safari.
©Satellite Educators Association, Inc. https://SatEd.org SEA.Newsletter@SatEd.org
Satellite Educators Association, Inc. is a 501(c)(3) non-profit educational organization.
The SEA Newsletter is published on-line monthly except January and August and available at no cost.
SEA terms, conditions, policies, ansd contact information are detailed HERE.
Unless otherwise listed, all photo and image credits are the authors of the articles.
Any opinons expressed in this Newsletter are those of the authors
and not necessarily those of the Satellite Educators Association, Inc.
Many SEA Newsletter items contain third-party links to sites not governed by Satellite
Educators Association, Inc. The viewer is cautioned to be aware of the terms of use and
privacy policies for those third-party sites.![]()