
OUR VISION
The world's finest educators supporting science, technology, engineering, and math (STEM) learning for pre-kindergarten to post-graduate students using real-world applications from satellites and satellite data.
OUR MISSION
To enhance the education environment to excite students about science, technology, engineering, and math through space-based technology -- satellites and satellite data.

William Shakespeare

Just don't give up trying to do what you really want to do. Where there is love and inspiration, I don't think you can go wrong.
Ella Fitzgerald

TABLE OF CONTENTS
Click a RED link to view article
Association News
John's Journey
M.Y. S.P.A.C.E. News
News from USGS
News from NOAA
News from NASA
More Lessons
from the Sky
Go to SEA Home Page

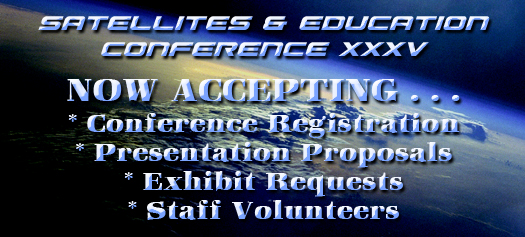
The Satellite Educators Association is please to announce Satellites & Education Conference XXXV, "Earth Speaks - We Listen!" happening on July 29-30, 2022 in both in-person and "virtual" online formats. The Conference Coordinator is now accepting...
New this year...The conference will be hosted live and in-person at Charter College of Education at California State University, Los Angeles, for the first time since 2019. The conference will also be hosted on ZOOM for those attendees, presenters, and exhibitors who cannot join us in person.
Although this hybrid-format is not without its challenges, the Executive Committee and Conference Planners are hard at work preparing a dynamite conference experience for all. This year's special focus: the James Webb Space Telescope. The conference agenda and schedule will be published as soon as it is finalized.
The goal of the Satellites & Education Conference is raising the level of awareness, in teachers and students grades K-12 and beyond, of the availability and use of satellite-based remote-sensing data and related engineering and technology opportunities and thereby fostering informed stewardship of our planet, its resources and inhabitants. For more than three decades, the annual Satellites & Education Conference has brought teachers and students together with resource-rich representatives of academia, the aerospace industry, and government - especially NOAA, NASA, USGS - providing knowledge and tools to address the challenges of 21st century STEM education.
This outstanding event for teachers has been offered each and every year since 1988. From 1988-2001, the conference was held at West Chester University in Pennsylvania. The conference has been hosted by Cal State LA since 2002.
Teachers attending the Satellites & Education Conference continuously report this is the best conference they ever attended. It is rare to find such a rich community of scientists and engineers from aerospace, NOAA, NASA, USGS, and university researchers interfacing so supportively with educators!
Don't miss the event of the summer celebrating 35 years of service and community in support of STEM education and an awareness of ever-changing global climate. Register at https://SatEd.org/conferences/ today!
(And did we mention Active Members of the Satellite Educators Association automatically receive a 23% discount on conference registration? Not a member yet? Or has your membership lapsed? No problem. Just include membership with your conference registration to receive the discount.)

[ Back to Top ]
Start planning now! Satellites & Education Conference XXXV, July 29-30, 2022, needs presenters and exhibitors for both the face-to-face conference at Cal State LA and on ZOOM!
Presenters can submit presentation proposals and exhibitors can request exhibit space -- all online.
Of particular interest are presentations and exhibits about or that include the James Webb Space Telescope.
Some may be asking how it is possible to exhibit on ZOOM for an in-person conference. There are pros and cons for both modes of presentation and exhibit. Check out the detailed information about benefits for presenters and exhibitors, co-presenters, co-exhibitors, facilities, handout distribution, and more at the links above. It's all available on-line now.
Below you will find links to the Conference Highlights pages of the last five Satellites & Education Conferences -- three were in-person (pre-COVID) and two were completely on-line. Peruse the pages and their downloadable Conference Programs at your convenience to get an idea of the type and quality of the presentations and exhibits that happen at Satellites & Education Conferences. Then consider how best to share your information.
Thank you in advance for supporting "Satellites & Education."
[ Back to Top ]
Still undecided about signing up for Satellites & Education Conference XXXV? Want to know what you are signing up for?
Watch https://SatEd.org/conferences/ for latest details about speakers, presenters, and exhibitors when the conference program is announced.
Take a look at these Conference Highlights pages and their downloadable Conference Programs from the last five years -- three from in-person conferences (pre-COVID) and the last two were on-line only. Each conference was extraordinary in its own way. Perusing the programs may give you as sense of the type and quality of happenings at Satellites and Education Conferences.
Then visit SEA's Conference home page to join us in person or on ZOOM for the 35th annual Satellites & Education Conference!
[ Back to Top ]


The Vic Everett Memorial Service Award is given to SEA members of good character who have demonstrated excellence in service to the Satellite Educators Association and others by helping promote the vision and mission of the organization inside and outside of SEA events and assisting in preparation and delivery of SEA programs.
Active SEA members can nominate deserving individuals online. The nominations are reviewed by the Selection Committee and the final decision is by the Executive Committee.
The award recipient is honored during the annual Satellites & Education Conference.
More information about Vic Everett and the Service Award can be found HERE and HERE.
To nominate a member for the Serevice Award, visit https://SatEd.org and select Member Log In. Follow the prompts Member Services and select Nominate for the Vic Everett Memorial Service Award.
[ Back to Top ]
Announcing the Annual Meeting fo the Satellite Educators Association on Thursday, July 28, 2022 at noon (PDT) on ZOOM.
Although the Executive Committee of the Satellite Educators Association held several meetings for members throughout this past year to receive members' input planning the 2022 conference, the By-Laws of the Satellite Educators Association, Inc. require an "Annual Meeting," the time and place to be determined by the Executive Committee but usually concurrent with the annual Satellites & Education Conference.
While the meeting is open to all, only currently "Active" members (those with dues paid at least through July 31, 2022) have voice and vote at the meeting. Other speakers may be recognized at the discretion of the meeting's presiding officer. For the sake of security, however, the ZOOM link and log-on code will be emailed only to Active members during the week before the meeting.
To check your membership status, visit https://SatEd.org, click Join Us, and select Check. Type in your first and last names and your email address. Be sure to use the form of your name and email that you previously used with SEA. Your membership status will be displayed.
New members may join and lapsed members may renew ay visiting https://SatEd.org, clicking Join Us, and selecting Continue. Membership is still only $20 per year. And, don't forget, Active members receive an automatic 23% discount on conference registration.
[ Back to Top ]


By John D. Moore, Executive Director, Institute for Earth Obervations at Palmyra Cove, New Jersey
Big Data, Data Literacy, Authentic Science, NGSS, CTE, PBL, Hands-On Learning, Critical Thinking, Geospatial Thinking, STEM. Recognize any of these educational strategies? I’m quite confident that you all can give examples of how these and other policy-like issues have informed and transformed national instructional strategies, classrooms, and student performance over the years. Or are some unfamiliar to you?
As I reflect on the journey of my lifetime, a clear benefit of its length becomes apparent – the opportunity it affords to look back at those innovative ideas when they were “new” and emerging as well as the people who poured time and energy into promoting and implementing them. Yet, many have not been sustainable in the schools. This raises a good question, "Why not?"
As our cadre of founding SEA members continue to age (gracefully) it becomes more urgent to identify and pursue pathways for the next generation of STEM professionals. As we approach this year’s Satellites and Education Annual Conference, we should collectively consider this a pressing issue. We have the statistical evidence that American students are ranked low in the fields of science and mathematics and have been for some time now. This, of course, translates directly into STEM careers which will impact both our national security and economy.
As I have previously written, there has always been a “national science agenda,” and you may recall my pointing out that there is often a disconnect between that agenda and science education. Reviewing potential funding resources is one way, perhaps the only way, to discovery what the agenda is focused on. Often, it seems, the prioritization of these funding resources leads to policy decisions – and therein lies my concern. Have we left the pursuit of striving for excellence and developing academic merit behind for other pressing issues impacting the sciences and, more broadly, STEM communities?

It should be noted here that regardless of the nature of the agenda, policies, and challenges, SEA has risen to the occasion, and in most cases exceeded expectations. Evidence? If you have not done so lately, I encourage you to check out More Lessons from the Sky in the SEA Lesson Library.
Continuing with the theme of promoting excellence in STEM, I’ve written several times about the high school students that have worked with me as interns, Max Friedman, Sriram Elango, and Kaleb Martin. This month (May) there will be two new interns working on Senior Class projects at the Institute for Earth Observations. They come after school, on their own time, and have created some amazing and innovative STEM products. The chief reason that they work on these projects with me is that they are not getting this type of advanced, real-life exposure to work in their schools. Simply put, they are not being challenged enough in school. This seems to be a growing problem that has a huge impact on STEM and its priorities for the USA.
This summer, at the Institute, we are looking forward to several project advancements. A3Sat v. 2.0 is in the planning stages. Version 2.0 will be more sophisticated technically with, perhaps, a simpler construction as focus on a different strategy for payload design. That will also move us a step closer to a “Tier 2” design. By comparison, a “Tier 3” design and construction would produce a “space-ready” CubeSat. The availability, or lack thereof, of the Raspberry Pi has also become a major concern. Based on the enormous success of our first pilot, we will complete the final stages of collecting and evaluating assessment data from our pilot-partners.
Don’t forget to check out Sriram’s description of his “Ground Station app” designed for A3Sat on the Congressional app Challenge site as his contribution to the A3Sat Enterprise. I also invite you to view and participate in the NSF 2022 STEM for ALL Video Showcase that is held May 10th - 17th, and, of course, check out our submission Earth SySTEM: Using Satellites to Monitor the Earth. There are hundreds of excellent videos to watch, and you can enter into discussions with the PIs. You can always check out previous years videos to get an idea of what to expect before this year’s event. The website is https://stemforall2022.videohall.com/.
Don’t forget to register for this year’s Satellites & Education Conference. Register online and share your ideas with a session presentation and/or exhibit. I am looking forward to seeing all of you there.
Remember - “you can teach anything with satellites”.
Stay safe - stay well!
For now, I'm John...and this is my journey.
[ Back to Top ]


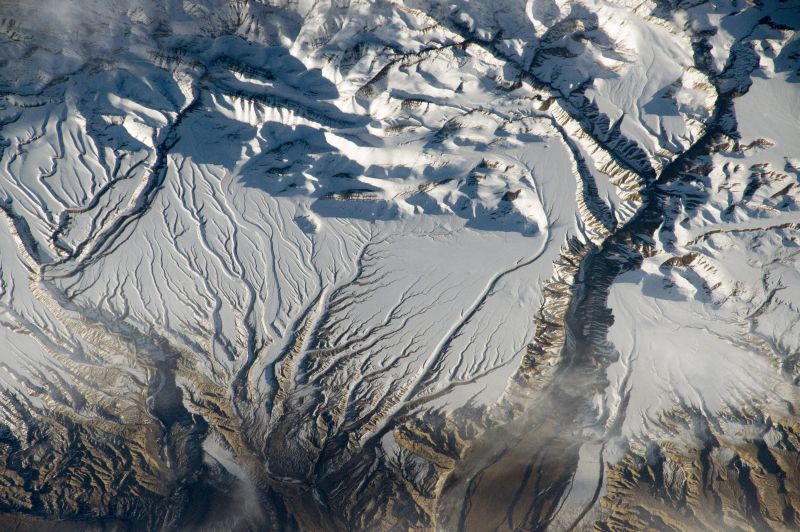
By SEA/M.Y. S.P.A.C.E. Staff
This Landsat 9 image shows Kyiv, Ukraine and surrounding area on April 24, 2022. The waveband imagery was downloaded from USGS in USGS Earth Explorer. The image was produced by combining Band 2 (visible blue), Band 3 (visible green), and Band 4 (visible red) with MultiSpec. The resulting TIFF image was further enhanced by adjusting the brightness and contrast with ImageJ.
-681.jpg)
For how many of these questions can you find answers?
Not all of these questions have quick and easy answers. Nonetheless, these are some of the questions with which reaserachers might grapple in order to better understand the image and, perhaps, use it constructively. Some of the questions may need additional research about the Operational Land Imager (OLI) and Thermal Infrared Sensor (TIRS) on Landsat 8 and Landsat 9. Some may be approached by downloading and re-imaging the wavebands with an application like MultiSpec or ImageJ. In doing so, it might be learned, for example, that trees and other vegetation are likely to relfect more visible green and near infrared whereas roads and building roofs might reflect more thermal infrared. This challenge involves visualization, analysis, and interpretation, and that interpretation includes an assessment of the suitability of this image's use in finding answers to the questions.
If needed, additional help can be found here...
Good hunting!
[ Back to Top ]

The following summary is from NASA's Landsat Science at https://landsat.gsfc.nasa.gov/about/history/
For an interesting and more complete history, see...Landsat Legacy, USGS
and Fifty Years of Exploration and Innovation: How Landsat Launched the Remote Sensing Era, USGS
"The Landsat program was created in the United States in the heady scientific and exploratory times associated with taming the atom and going to the Moon,” explains Dr. John Barker. In fact, it was the Apollo Moon-bound missions that inspired the Landsat program. During the early test bed missions for Apollo, photographs of Earth’s land surface from space were taken for the first time. “This photography has been documented as the stimulus for Landsat,” explains Dr. Paul Lowman, who proposed the terrain photography experiment for the last two Mercury missions, the Gemini missions, and the Apollo 7 and 9 missions.
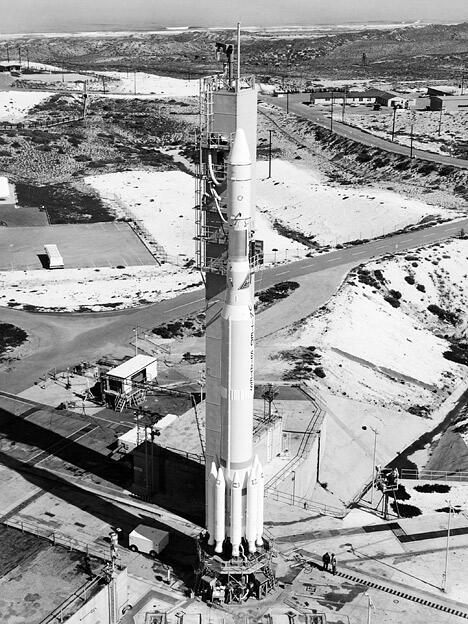
Thor-Delta rocket prepared to launch Landsat 1, 1972.
In 1965, director of the U.S. Geological Survey (USGS), William Pecora, proposed the idea of a remote sensing satellite program to gather facts about the natural resources of our planet. Pecora stated that the program was “conceived in 1966 largely as a direct result of the demonstrated utility of the Mercury and Gemini orbital photography to Earth resource studies.” While weather satellites had been monitoring Earth’s atmosphere since 1960 and were largely considered useful, there was no appreciation of terrain data from space until the mid-1960s. So, when Landsat 1 was proposed, it met with intense opposition from the Bureau of Budget and those who argued high-altitude aircraft would be the fiscally responsible choice for Earth remote sensing. Concurrently, the Department of Defense feared that a civilian program such as Landsat would compromise the secrecy of their reconnaissance missions. Additionally, there were also geopolitical concerns about photographing foreign countries without permission. In 1965, NASA began methodical investigations of Earth remote sensing using instruments mounted on planes. In 1966, the USGS convinced the Secretary of the Interior, Stewart L. Udall, to announce that the Department of the Interior (DOI) was going to proceed with its own Earth-observing satellite program. This savvy political stunt coerced NASA to expedite the building of Landsat. But, budgetary constraints and sensor disagreements between application agencies (notably the Department of Agriculture and DOI) again stymied the satellite construction process. Finally, by 1970 NASA had a green light to build a satellite. Remarkably, within only two years, Landsat 1 was launched, heralding a new age of remote sensing of land from space.
Thor-Delta rocket image credit: public domain; Source: USGS
[ Back to Top ]


From NOAA News & Features
February 3, 2022
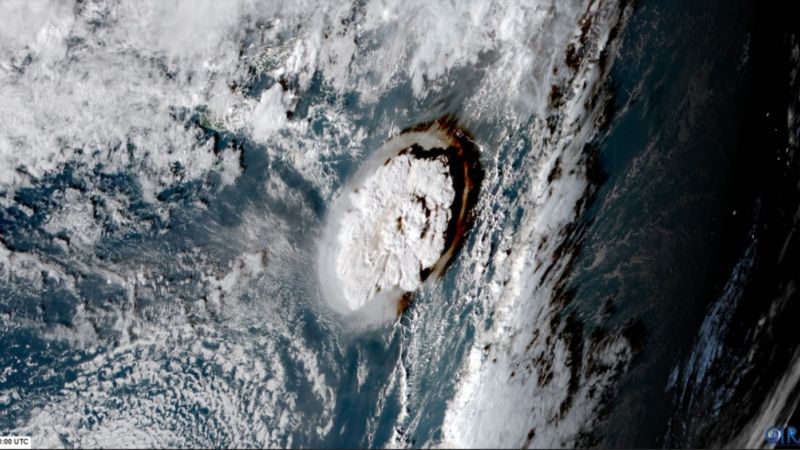
An eruption of the Hunga Tonga-Hunga Ha’apai volcano in the South Pacific Ocean on January 15, 2022 created a rare event never before detected with modern instruments. A powerful tsunami raced forward, leaving an untold number of lives hanging in the balance.
Notably, only 5% of tsunamis are triggered by volcanic activity — and this one was massive. The waves were measured thousands of miles away, as far as the Caribbean.
Immediately, NOAA scientists at the tsunami warning centers sprang to action. NOAA’s global network of ocean buoys, water-level stations and other observation tools informed tsunami alerts for coastal locations throughout the Pacific Basin, parts of Alaska and the U.S. West Coast.
A powerful tsunami raced forward, leaving an untold number of lives hanging in the balance.
NOAA communicated with emergency managers about the tsunami and potentially deadly hazards it could bring to coastlines around the Pacific. Timing and impact information was critical to making a multitude of life-safety decisions.
Scientists believe the last time a volcano set off a tsunami this large was the Krakatoa eruption of 1883. They can’t be sure, though, because the technology to observe ocean waters in real-time around the globe did not exist, including tsunami warnings. The Tonga eruption was the first event of its kind that scientists could track in detail as it unfolded.
[ Back to Top ]
From NOAA
April 11, 2022
Be ready for hurricane season. Today you can determine your personal hurricane risk, find out if you live in a hurricane evacuation zone, and review/update insurance policies. You can also make a list of items to replenish hurricane emergency supplies and start thinking about how you will prepare your home for the coming hurricane season. If you live in hurricane-prone areas, you are encouraged to complete these simple preparations before hurricane season begins on June 1.
Register at https://hurricane2022.eventbrite.com.
[ Back to Top ]
From NOAA News & features
April 7, 2022
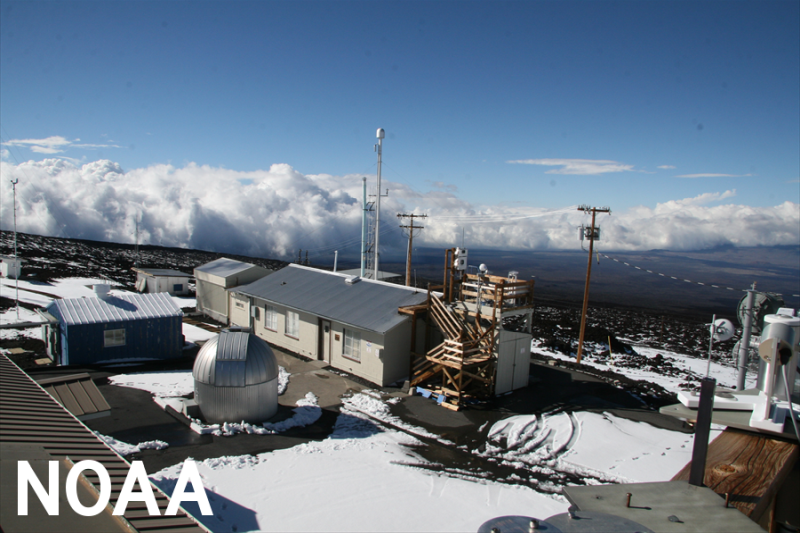
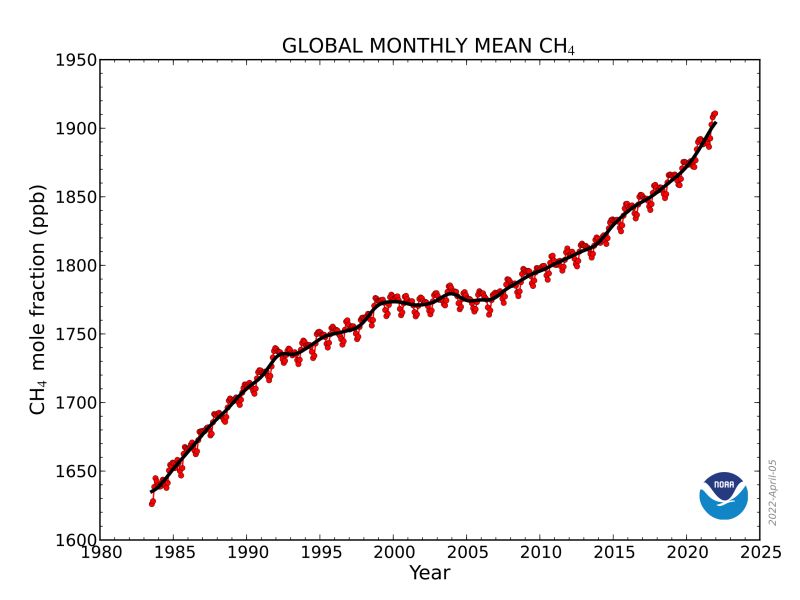
For the second year in a row, NOAA scientists observed a record annual increase in atmospheric levels of methane, a powerful, heat-trapping greenhouse gas that’s the second biggest contributor to human-caused global warming after carbon dioxide.
NOAA’s preliminary analysis showed the annual increase in atmospheric methane during 2021 was 17 parts per billion (ppb), the largest annual increase recorded since systematic measurements began in 1983. The increase during 2020 was 15.3 ppb. Atmospheric methane levels averaged 1,895.7 ppb during 2021, or around 162% greater than pre-industrial levels. From NOAA’s observations, scientists estimate global methane emissions in 2021 are 15% higher than the 1984-2006 period.
[ Back to Top ]


Edited by Sean Potter, NASA
March 17, 2022
Following the completion of critical mirror alignment steps, NASA’s James Webb Space Telescope team expects that Webb’s optical performance will be able to meet or exceed the science goals the observatory was built to achieve.
On March 11, the Webb team completed the stage of alignment known as “fine phasing.” At this key stage in the commissioning of Webb’s Optical Telescope Element, every optical parameter that has been checked and tested is performing at, or above, expectations. The team also found no critical issues and no measurable contamination or blockages to Webb’s optical path. The observatory is able to successfully gather light from distant objects and deliver it to its instruments without issue.
While the purpose of this image was to focus on the bright star at the center for alignment evaluation, Webb's optics and NIRCam are so sensitive that the galaxies and stars seen in the background show up.
[ Back to Top ]
By Carol Rasmussen, NASA Jet Propulsion Laboratory
April 28, 2022
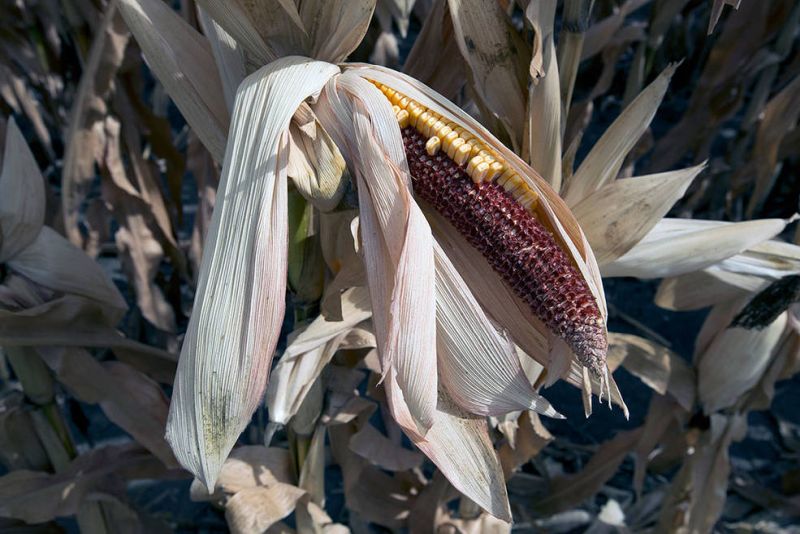
Troubles never come singly, the proverb says. A new NASA study shows that the old saying will become increasingly true of climate troubles in a warmer world. The study shows that extreme weather events such as floods and heat waves will increasingly cluster closer in time and space, heightening the risks of crop failures, wildfires, and other hazards to society.
By the year 2100, increases in heat waves, drought, and excessive rainfall combined will double the risk of climate-related failures of corn harvests in at least three of the world’s six major corn-growing regions in the same year, according to the study, published in Environmental Research Letters. The U.S. Midwest is at the highest risk of being the site of one of these multiple harvest failures.
Many previous studies have modeled changes in a single climate indicator, such as the number of days above 100 degrees Fahrenheit (38 degrees Celsius) in a certain region. But the greatest impacts usually come when extremes occur simultaneously or in close sequence. For example, Western states are all too familiar with the scenario where excessive heat and drought fuel a wildfire, and then heavy rainfall creates a new hazard, landslides, in the burned area.
Climate scientists have been working for years to understand and represent these complex chains of interacting events numerically in climate models – a daunting task that pushes the limits of available computing power. “It’s only in the last five or so years that a framework has been developed for applying compound-risk thinking to climate analysis in a way that you can actually compute without getting in hopelessly over your head,” said study lead author Colin Raymond, a scientist at NASA’s Jet Propulsion Laboratory in Southern California.
[ Back to Top ]
By Joe Atkinson, NASA Langley Research Center
April 20, 2022
A NASA scientist is adding a new dimension to the climate-observing powers of a satellite instrument whose main mission is to measure the height of Earth's ice sheets and sea ice. And the inspiration for this new method comes from how ants walk around their colonies.
Using a concept adapted from the mathematics and biology communities, Yongxiang Hu of NASA's Langley Research Center in Hampton, Virginia, developed a method to directly measure snow depth using lidar measurements from the Ice, Cloud and land Elevation Satellite-2 (ICESat-2). Lidar uses pulses of laser light to make measurements, similar to how sonar uses sound. Hu worked with other scientists at NASA, the University of Arizona, Stevens Institute of Technology, and Ball Aerospace.
Snow depth is an important measurement in understanding climate, weather, and Earth's water cycle, but there are limits to current measurement methods. To determine how to use ICESat-2's laser to directly measure snow depth, Hu turned to a principle he adapted from biologists and physicists who figured out the average length of the path an ant travels inside its colony before coming back out. What those scientists came up with is that the average time an ant walks around inside the colony before coming back is roughly four times the volume of the colony divided by its surface area.
Similar to an ant disappearing into a colony and walking around randomly, a photon of light from a lidar enters the snow and bounces around as it is scattered by the snow particles until it exits and is collected by the telescope on ICESat-2. All this happens very fast — at the speed of light.
Using a special model simulation and an equation almost identical to the one from the ant problem, Hu discovered he could measure the average distance a photon traveled inside the snow before it’s eventually measured by the lidar and determined the snow depth is half of that average distance.
"The model suggests that the photon is traveling inside the snow almost exactly the way the ant travels inside its colony," said Hu.
[ Back to Top ]


What is a man-made satellite? How big is it? How does it get into orbit around the Earth? How does it stay in orbit without falling to the ground? What does a satellite do? How is it made? Learners in grades 3 and 5 investigate these questions and deliberate the best design for a model satellite of their own creation.
This lesson plan represents a significant update and upgrade since its first publication in August 2011. The lesson is based on an original idea written by Betty Conway and published in the Satellite Educators Association’s Lessons from the Sky in 1995.
This student-centered lesson is built on specific Next Generation Science Standards and promotes teamwork and respect for others while challenging learners to support their conclusions with evidence.
| Grade Level: | 3, 5 |
| Time Requirement: | 1-2 class periods |
| Prerequisites: | None |
| Relevant Disciplines: | Physical Science, Engineering Design |
[ Back to Top ]
Share your satellite-based lesson ideas with the teaching comunity.
Send us a full lesson plan, or simply suggest a lesson idea. If you found the idea online, please share the source as well. The lesson can be about anything that helps connect learners with satellite-based technology - any grade level K-12 - any STEM subject area or geography.
"Satellite-technology" includes any part of the science, math, engineering, or technology of satellites, rockets, and remote sensing instruments as well as the use of any environmental satellite data to explore questions related to aspects of global change and local impacts in the long term, short term, and catastrophic time frames. Of special interest are lessons providing oppotunities for learners to inquire, experiment, and apply mathematics.
Perhaps you designed a lesson yourself - we will happily prepare it for future publication in More Lessons from the Sky and inclusion in the SEA Lesson Plan Library. Perhaps you found a worthy lesson plan published elsewhere - we can research it inclusion in a lesson plan spotlight. In either case, you will receive full credit for developing and/or brining theless to the attendtion of the teaching community. Don't forget to share your insights if you tried the lesson with students.
Send your ideas to SEA.Lessons@SatEd.org.
[ Back to Top ]
![]()
This edition of the SEA Newsletter was produced in HTML5.
It is best viewed with most recent updates of Firefox, Edge, Chrome, Opera, or Safari.
©Satellite Educators Association, Inc. https://SatEd.org SEA.Newsletter@SatEd.org
Satellite Educators Association, Inc. is a 501(c)(3) non-profit educational organization.
The SEA Newsletter is published on-line monthly except January and August and available at no cost.
SEA terms, conditions, policies, ansd contact information are detailed HERE.
Unless otherwise listed, all photo and image credits are the authors of the articles.
Any opinons expressed in this Newsletter are those of the authors
and not necessarily those of the Satellite Educators Association, Inc.
or any of its officers, members, or representatives.
Many SEA Newsletter items contain third-party links to sites not governed by Satellite
Educators Association, Inc. The viewer is cautioned to be aware of the terms of use and
privacy policies for those third-party sites.![]()