

OUR VISION
The world's finest educators supporting science, technology, engineering, and math (STEM) learning for pre-kindergarten to post-graduate students using real-world applications from satellites and satellite data.
OUR MISSION
To enhance the education environment to excite students about science, technology, engineering, and math through space-based technology -- satellites and satellite data.


Saint Basil

When you rise in the morning, give thanks for the light, for your life, for your strength. Give thanks for your food and for the joy of living. If you see no reason to give thanks, the fault lies in yourself.
Tecumseh

TABLE OF CONTENTS
Click a RED link to view article
Association News
John's Journey
Satellites with Ed
M.Y. S.P.A.C.E. News
In the News
For Teachers
More Lessons
from the Sky


From the Bureau of Transportation Statistics, US Department of Transportation
March 12, 2021
On the first Sunday in November millions of Americans turn their clocks back 1 hour to mark the end of Daylight Savings Time (DST), an annual practice that has its roots in transportation. Despite DST’s more than 50 years of nearly uniform observance since 1966, 29 states introduced legislation between 2015 and 2019 to abolish the twice-yearly switching of clocks. In May 2019, for example, Tennessee and Washington’s governors signed bills to extend DST year round. Several states in New England made similar proposals with one additional condition: they will only change to year-round DST if their neighboring states do the same, thereby avoiding the economic and transportation repercussions of neighboring states having different local times. The authority to change DST, however, ultimately lies with the Department of Transportation, a power it has held since its foundation in 1966.
Time zones were introduced by the major railroad companies in 1883 to resolve confusion and avoid train crashes caused by different local times. As the United States entered World War I in 1918, the government delegated time zone supervision to the federal organization in charge of railroad regulation—the Interstate Commerce Commission (ICC). The new concept of DST was also overseen by the ICC to assist in the war effort. Initially introduced by Germany during the war to conserve fuel and power by extending daylight hours, the United States soon followed suit.
Time zones were introduced by the major railroad companies in 1883 to resolve confusion and avoid train crashes caused by different local times. As the United States entered World War I in 1918, the government delegated time zone supervision to the federal organization in charge of railroad regulation—the Interstate Commerce Commission (ICC). The new concept of DST was also overseen by the ICC to assist in the war effort. Initially introduced by Germany during the war to conserve fuel and power by extending daylight hours, the United States soon followed suit.
After World War I, DST was nationally abolished but allowed to continue on a state-by-state basis. As a result, confusion and collisions caused by different local times once again became a transportation issue. In 1966, the Department of Transportation was founded to serve as a “focal point of responsibility for transportation safety” and given regulatory power over time zones and DST. DST was implemented uniformly across the Nation, with dates for the twice-yearly transitions set by law. This still holds true today. With the exception of Arizona and Hawaii, every state must continue to observe DST between March and November, unless otherwise exempted by State law.
This is a short but well-documented article. Check-out citations at https://www.bts.gov/geospatial/daylight-savings-time.
Anne Buckle offers more interesting tidbits in History of Daylight Savings Time (DST) and Daylight Savings Time in the USA.
BOTTOM LINE -- The United States has not yet implemented a permanent daylight savings time plan. At 2:00 AM, Sunday, November 6, 2022, all states in the USA except Arizona and Hawaii set clocks back to 1:00 AM.

[ Back to Top ]


Steve LaDochy has been a member of the SEA since 2002 while serving as Professor of Geosciences and Environment at Cal State LA. He served for several years as SEA Membership Chair. Steve is very actrive with William Patzert in the American Meteorological Society local chapter. SEA recently discovered this study co-authored by Steve. Among other things, this study highlights the need to consider the source and quality of any data analyzed in a long-term study.
All of the listed authors for this study are well-known to SEA members and attendees of Satellites & Education Conferences. William Patzert and Josh Willis of JPL have both been Conference keynote speakers, and Josh has been a helpful supporter of the M.Y. S.P.A.C.E. Program. Professor Pedro Ramirez, Steve's long-time colleague in the Department of Geosciences and Environment, has co-presented with Steve at many Satellites & Education Conferences.
By William Patzert, Steve LaDochy, Pedro Ramirez, Josh Willis
NASA's Jet Propulsion Laboratory & California State University, Los Angeles
2016
ABSTRACT
In August 1999, the official downtown Los Angeles weather station moved to the University of Southern California campus, 3.78 miles (almost 6 km) to the southwest of its previous location near the city center at the Department of Water & Power (DWP). This move resulted in a discontinuity in the weather records. A comparative study of daily temperatures and precipitation recorded at USC and DWP from 1999 to 2014 clearly shows that the move resulted in cooler, drier, and less-extreme conditions. Maximum temperatures averaged 2.4ºF (1.3ºC) higher at DWP, but minimum temperatures were nearly the same. Precipitation at USC for the study period averages about 0.77" (19.6 mm) less than the DWP location. Extreme record temperatures and precipitation are also less frequent at the USC site. Since the original station is still operational, DWP should remain the official LA downtown station, with USC becoming a Cooperative station, like UCLA.
Read the full report published in The California Geographer in 2015 at Academia https://www.academia.edu/89812290/Los_Angeles_Weather_Stations_relocation_impacts_climate_and_weather_records
[ Back to Top ]


By Ron Gird, Meteorologist and former Satellite/Spaceflight and Outreach Program Manager for the National Weather Service
Hi Folks.
As a meteorologist formerly with the National Weather Service, it is my pleasure to share the seasonal outlooks as they become available. NOAA seasonal outlooks provide the likelihood that temperatures and total precipitation amounts will be above-, near-, or below-average, and how drought conditions are anticipated to change in various regions of the United States. As always, the outlook may be good news for some, perhaps not for others. This one spans December 2022 through February 2023. Enjoy! -Ron
From NOAA News & Features at https://www.noaa.gov/news-release/us-winter-outlook-warmer-drier-south-with-ongoing-la-nina"
October 20, 2022
This year La Niña returns for the third consecutive winter, driving warmer-than-average temperatures for the Southwest and along the Gulf Coast and eastern seaboard, according to NOAA’s U.S. Winter Outlook released today by the Climate Prediction Center — a division of the National Weather Service. Starting in December 2022 through February 2023, NOAA predicts drier-than-average conditions across the South with wetter-than-average conditions for areas of the Ohio Valley, Great Lakes, northern Rockies and Pacific Northwest.
“The hardworking forecasters at NOAA’s Climate Prediction Center produce timely and accurate seasonal outlooks and short-term forecasts year-round,” said Michael Farrar, Ph.D., director of the National Centers for Environmental Prediction. “NOAA’s new supercomputers are enabling us to develop even better, more detailed forecast capabilities, which we’ll be rolling out in the coming years.”
NOAA forecasters, in collaboration with the National Integrated Drought Information System (NIDIS), continue to monitor extreme, ongoing drought conditions that have persisted in the Western U.S. since late 2020, as well as parts of the central U.S. where historic low-water conditions are currently present.
“Drought conditions are now present across approximately 59% of the country, but parts of the Western U.S and southern Great Plains will continue to be the hardest hit this winter,” said Jon Gottschalck, chief, Operational Prediction Branch, NOAA’s Climate Prediction Center. “With the La Niña climate pattern still in place, drought conditions may also expand to the Gulf Coast.”
[ Back to Top ]


By John D. Moore, Executive Director, Institute for Earth Observations at Palmyra Cove, New Jersey
"You may remember reading John’s Journey last month that highlighted issues at the NSF concerning Intellectual Merit and Broadening Participation. It focused on the needs for both as it addresses not only STEM education, but also the role of, and need for, STEM professionals in his country’s future. Here’s more on the subject.
On October 25, 2022 the NSF announced name changes to the education directorate, Directorate for STEM Education, or EDU. Now, the division will be known as the Division of Equity for Excellence in STEM, or EES.
"We are at an important moment as a nation, where we are witnessing the amazing impact that STEM disciplines can have in our lives and communities every day. As the largest investor in STEM talent in the federal government, the new name for the directorate responsible for inspiring and unleashing talent across our nation should represent the work that NSF has been doing for decades and into the future,” stated Sethuraman Panchanathan, NSF Director. He continued, “STEM education research and practice leads to the design and implementation of new knowledge and skills critical for training the next generation of scientists, engineers, educators, and the technical workforce. That is why NSF is strongly committed to investing in the development of ideas and people. This is how our nation will remain in the vanguard of scientific progress and technological innovation."
It would seem that policies are in a state of transition, and, as an organization, we should be well informed in these areas to guide our work in the education, industry, government arenas overall as well as specific impacts for teachers and students. The 35th annual Satellites and Education Conference was held just a few months ago in July. Those present witnessed a community of STEM professionals bringing together teachers, students, government, and industry to explore emerging technology, reconnect with satellite direct read-out made easy, and re-introduce teachers to the how of bringing those capabilities into classrooms. At each and every one of thirty-five consecutive annual conferences, SEA has piloted ways students could use these new resources and explore how to improve them. It was, and continues to be, an authentic and active evolution of what was once known as Science, Technology, & Society (STS) which, I suggest, provided the building blocks of STEM Education. SEA’s M.Y. S.P.A.C.E. Program capitalized on student interaction and built an international community of students while teaching them to build a student-oriented research platform – one purposed to an investigation conducted in their own communities and countries then shared with other local teams at the M.Y. S.P.A.C.E. Annual Meeting to build a global analysis of their common research theme.

Something to consider for the future, last month I wrote about the two equal components of NSF grants, i.e. Intellectual Merit and Broadening Participation. Broadening Participation, especially in underrepresented groups, has in recent years become a huge focus of not only NSF solicitations, but those of NASA and NOAA and other federal funding entities. While Intellectual Merit generally should be innovative and unique such as a new approach to a problem, the same is not true of Broadening Participation. Many Principal Investigators view Broadening Participation as an educational or public outreach project. Although, in truth, it has a much broader focus. Solicitations for NSF grant proposals generally require a section explaining how the proposing agency plans to incorporate other community entities in the grant action or dispersal of results and how they will be impacted. Unfortunately, it is sometimes true that proposal’s lack sufficient community outreach and involvement. To help fill that gap, I recently suggested to the Directorate for Geosciences CubeSat Program a list of several well-established programs that could be included in grant proposals in response to the Broadening Participation requirement. Imagine, if you will, what it would be like if every funded CubeSat project included one or more of these in the broader impact section of its proposal. It would make a huge difference in our community. As the A3Sat project continues to evolve and gain momentum, this will be my approach looking towards the future.
The SmallSat Education Conference at Kennedy Space Center in Florida will have just taken place by the time this edition of the November SEA Newsletter is released. The conference is shaping up very nicely with over 228 pre-registered guests with a full program agenda offered. As the inaugural conference, I consider this a huge success! Congratulations to Kevin Simmons, and his team, for all their hard work and dedication to this topic of introducing pre-college students to the world of Small Satellites and commitment to educational excellence for all students.
A special announcement at the conference: The “CubeSats in Peru” project with STEAM World will be announced as a collaborative effort between several organizations, including the Institute for Earth Observation’s A3Sat, with 15 schools throughout Peru. It is a new, and exciting journey ahead.
I look forward to reporting on my journey to the SmallSat Education Conference next month.
Please join me in congratulating CubeSat colleague and friend, Dr. Jin Kang, and the US Naval Academy as they launch their next CubeSat Project on NASA's Northrop Grumman 18th Commercial Resupply Services Mission Launch. The USNA “Rsat” is scheduled to launch at Wallops Flight Facility, on the Eastern Shore of Virginia, Sunday, November 6, 2022 at 5:50 AM (ET). For those who didn’t know, YES there is a Spaceport in Virginia! For more information go to: https://www.northropgrumman.com/space/nasa-commercial-resupply-mission-ng-18/#:~:text=The%20NG%2D18%20Cygnus%20spacecraft%20is%20scheduled%20to%20launch%20aboard,0A%20on%20Wallops%20Island%2C%20Virginia
Finally, there are not enough words to thank Pete Arvedson for his tireless efforts and commitment to excellence as Editor of the SEA Newsletter. Thank you for your innovation, being a Satellite Educator and leader, and more importantly, a good friend, for over three decades. THANK YOU!
Remember - “you can teach anything with satellites!”
Stay safe - stay well!
For now, I'm John...and this is my Journey.
[ Back to Top ]


By Edward Murashie, President, ProEngineered Solutions
With the Atlantic hurricane season coming to a close at the end of the month, there was a lot of press about the Geostationary Operational Environmental Satellite (GOES). GOES is one of the best tools for tracking hurricanes because of its unique orbit. Remember, a satellite’s altitude determines how fast the satellite must travel to balance with gravity and stay in orbit. The average altitude of a GOES satellite is about 22,300 miles (36,000 km), far enough away to provide a hemispheric view of the Earth. At this altitude, one revolution of the satellite in an equatorial orbit takes the same amount of time as one rotation of the Earth on its axis. The result: a geostationary orbit in which the satellite “appears” to be stationary over the equator. Therefore, the only moving objects in GOES images are weather phenomenon like hurricanes.
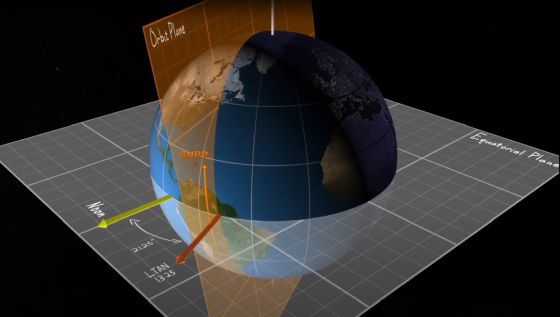
Another orbit type, the sun synchronous polar orbit, provides a different perspective. How is this orbit type different? Let’s say you want to take a picture of the Earth (from a satellite) and you want consistent lighting, then you want your satellite in a sun synchronous polar orbit. In the graphic below, the yellow arrow always represents local noon and is in the direction of the sun. At approximately 512 miles (824 km) altitude, a satellite traveling in a polar orbit (one where the orbital path passes very near the North and South poles) will cross the equator at the same time every day. The satellite orbit is offset from the noon vector by about 21° so it always crosses the equator on its north-bound pass at 1:25 PM. Thus, the name “sun synchronous orbit.” Why 1:25 PM? This seems to be the time of day when the sun has heated the Earth’s surface and atmosphere enough to develop weather changes we might want to observe. We must also remember that the Earth is rotating beneath the orbit, so the overlapping view of the Earth under the satellite will shift westward on each orbit. A JPSS satellite in sun synchronous orbit will see every part of the Earth twice during its 14 orbits each day. The overall advantage: At this altitude, JPSS is close enough to provide region views of the Earth in greater detail than geostationary views. It should also be noted that Europa, Russia, and China also operate polar-orbiting weather satellite systems designed to provide similar data for their areas of the globe by crossing the equator mid-morning.
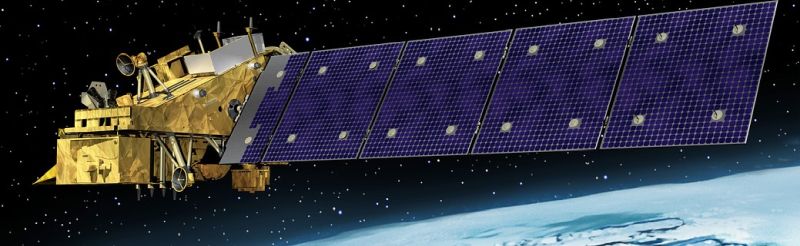
The first satellite in NOAA’s newest and most advanced series of polar orbiting weather satellites was Suomi-NPP. Originally, Suomi National Polar-orbiting Partnership (Suomi-NPP) was an initiative of the National Aeronautics and Space Administration (NASA), the National Oceanic and Atmospheric Administration (NOAA), and the Department of Defense (DOD) to combine civilian and military weather satellites into one system. The idea was abandoned before the Suomi-NPP launch in October 2011. Designed as a research vessel with a 5-year life expectancy, Suomi-NPP became an operational satellite delivering exceptional performance for over 11 years. The satellite was renamed to honor Dr. Verner E. Suomi, late of the University of Wisconsin – Madison, considered by many to be the father of satellite meteorology.
JPSS-1 was launched at Vandenberg Airforce Base in California on November 2017 aboard the second-to-last United Launch Alliance (ULA) Delta II rocket and was designed with a 7-year life. It was placed in the same orbital location as Suomi-NPP but half of an orbit ahead of it. Once in orbit it was renamed NOAA-20. JPSS-2 will also be launched from Vandenberg, since renamed Vandenberg Space Force base, on November 10 at 1:25 AM PST aboard the last ULA Atlas V to be launched from the West Coast. It will replace Suomi-NPP in its orbital location, but NOAA hopes to continue Suomi-NPP transmissions.
For a more complete and visual description of the JPSS and sun synchronous orbits, you are invited to watch this clear and informative NASA YouTube video by clicking the image below or following this link: https://www.youtube.com/watch?v=MCnByJyuok8.
As Tim Walsh, JPSS Director for NOAA, said during the JPSS-2 press briefing, “A dust storm in Africa can impact the development of a hurricane on the East Coast”. Therefore, global weather observations are key for weather prediction models.
With polar satellites providing an estimated 80% of the data for numerical predication models, JPSS and other polar satellites are the backbone of the United States weather forecast system. With the number of disasters due to weather increasing, accurate forecasts are more important now than ever before. During the press briefing, Irene Parker, Deputy Assistant Administrator Systems for NESDIS, emphasized this point by stating that between the years of 2017 to Sept 2022 there were 104 billion-dollar disasters as compared to 15 between 1987 and 1991.
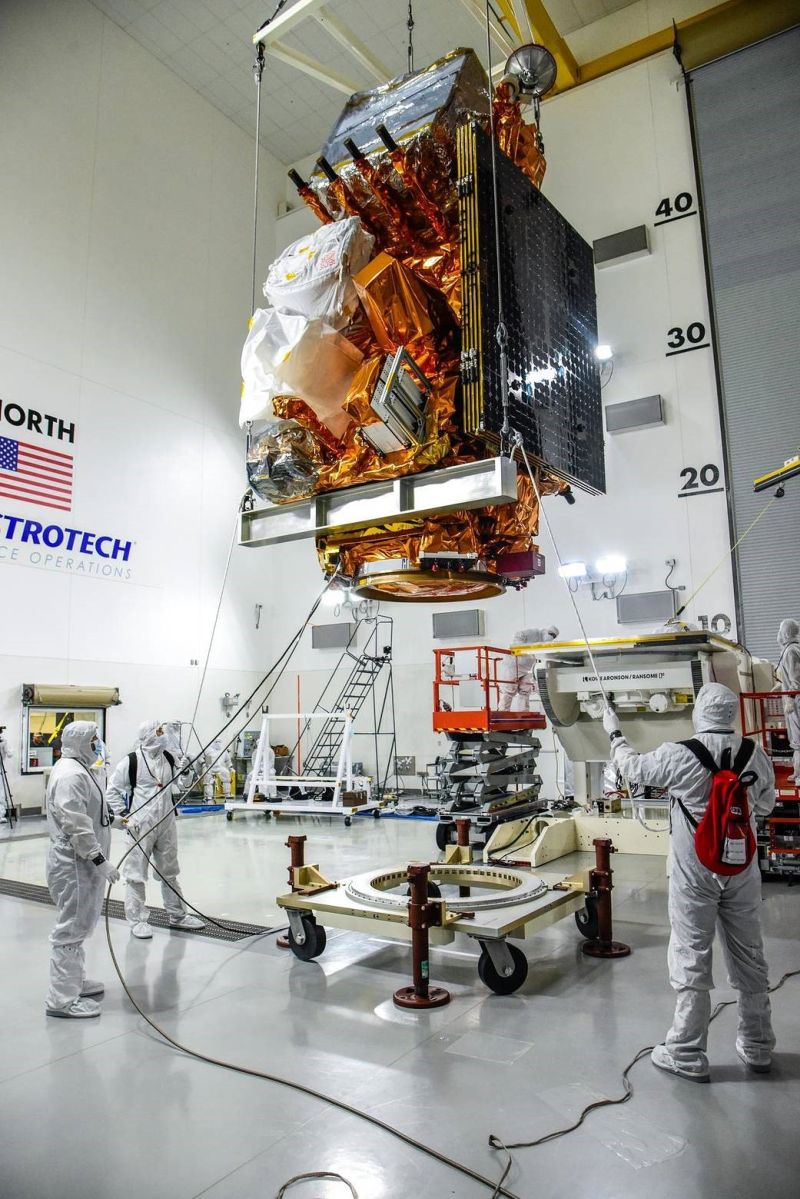
The JPSS-2 satellite bus was designed, built and tested by Northrop Grumman at their Gilbert, Arizona, facility. It is similar to the bus used for the recent Landsat, Icesat, and future JPSS-3 and JPSS-4 satellites, but different than the JPSS-1 bus which was a Ball Aerospace design. The instruments and performance are similar between JPSS-1 and JPSS-2 except the Clouds and Earth’s Radiant Energy System (CERES) flown on JPSS-1 is not being flown on JPSS-2. CERES measures the heat radiating to and from the Earth.
Northrop Grumman also designed and manufactured the Advanced Technology Microwave Sounder and integrated the following instruments on the spacecraft bus:
Together these instruments provide severe weather protection and environmental monitoring of the atmosphere, oceans, and land in the short term. They also contribute to the over 50 years of long term data to help monitor climate change.
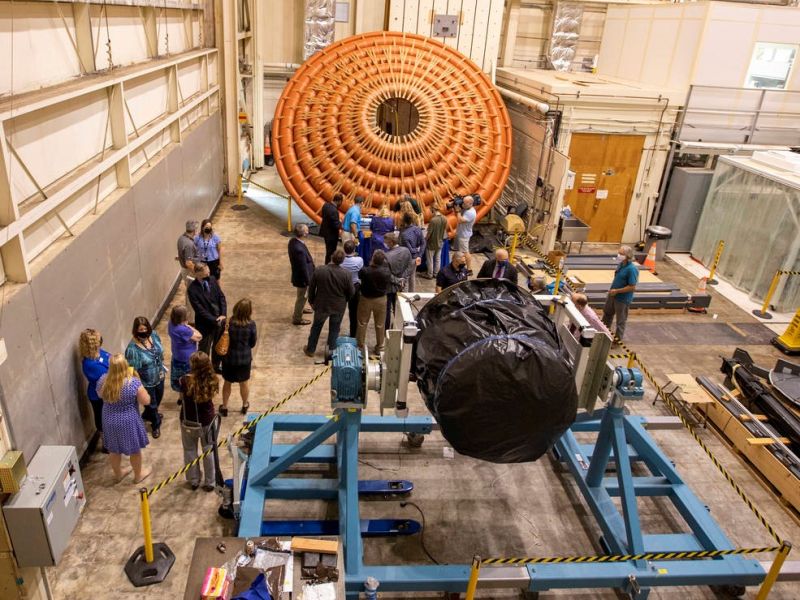
As with many rocket launches, there is a piggyback mission that launches with the primary payload. For JPSS-1 that was several CubeSats, some designed and built by students. For JPSS-2 it will be the first orbital flight of the Low Orbit Flight Test Inflatable Deaccelerater (LOFTID), a 20-foot inflatable heat shield. It is a woven thermal protection system polymer that is 10 times stronger than steel by weight. If all goes well someday it could land larger payloads on Mars or bring low Earth orbit space hardware back to the Earth. LOFTID is packed in a canister and mounted under JPSS-2 in the payload fairing atop the Atlas rocket.
Once JPSS-2 is released from the rocket, there will be two rocket burns to lower the orbit and point LOFTID in the right direction before being released. The whole mission will last a little over two hours and will splash down several hundred miles east of Hawaii but not before a backup data recorder is ejected. The recorder and aeroshell will be recovered and studied.
The project is managed by NASA with contributions by ULA and multiple small businesses.
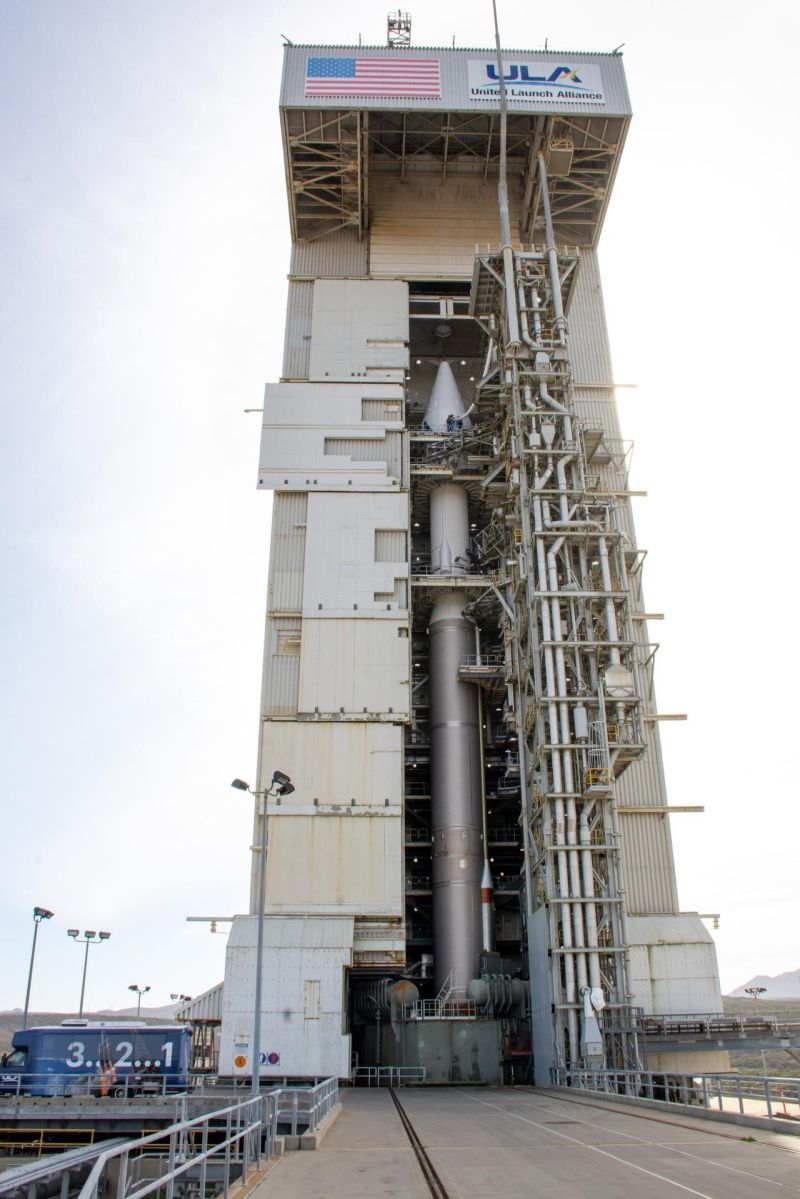
The United Launch Alliance (ULA) Atlas V 401 configuration rocket stands 191 feet (58.2 m) tall, weighs about 753,000 pounds (342,000 kg) and will have over 860,000 pounds (390,000 kg) of thrust when it launches JPSS-2 and LOFTID. The 4 in 401 means it is using a four-meter diameter fairing, the 0 means there are no solid rocket boosters, and 1 means there is one Centaur second stage. Because of the super stack height of JPSS-2 and LOFTID, the medium-sized 10-meter height extended payload fairing is used. There have been 40 launches of the Atlas V 401 rocket with the first one in 2002 and all missions were declared a success.
This is the last ATLAS V to be launched from the west coast and there are no more ULA Delta rockets. So once JPSS-2 is launched from Space Launch Complex 3 (SLC-3), SLC-3 will be modified to handle the new ULA Vulcan Centaur rocket and ready for launches around spring 2024.
If you are in the Lompoc area just outside the gates of Vandenberg Space Force Base near the time of any launch, always check out the city’s website https://explorelompoc.com/events/ as they usually have something planned for tourists.
For JPSS-2, if you are a kid or kid at heart, check out the NESDIS NOAA JPSS education website https://www.nesdis.noaa.gov/about/k-12-education/jpss-education . There you will find learning activities for all ages including learning more about the satellite, its science and even 3D printing a JPSS satellite!
There is one more special orbit where NOAA places its satellites, stay tuned.
As always if you have questions or comments, please email me at eamurashie at gmail dot com.
[ Back to Top ]
From NOAA News & Features at https://www.noaa.gov/multimedia/photos-images/photo-story-fighting-fire-with-forecasts
September 20, 2022
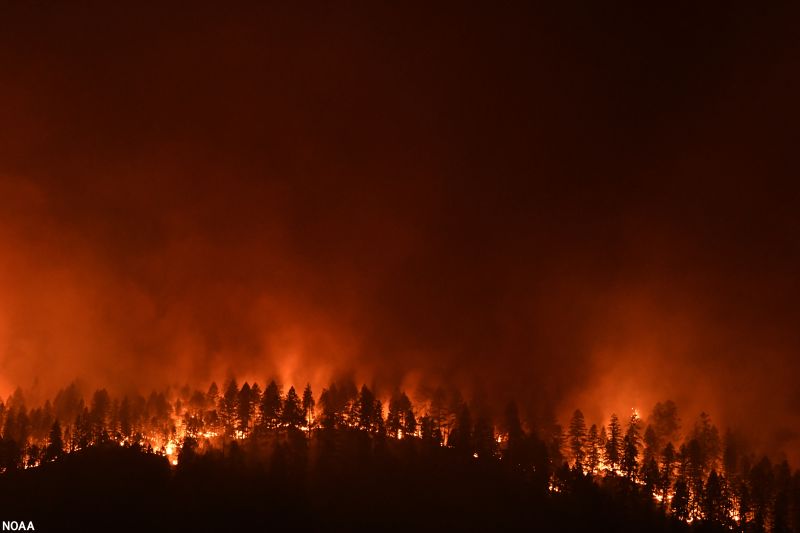
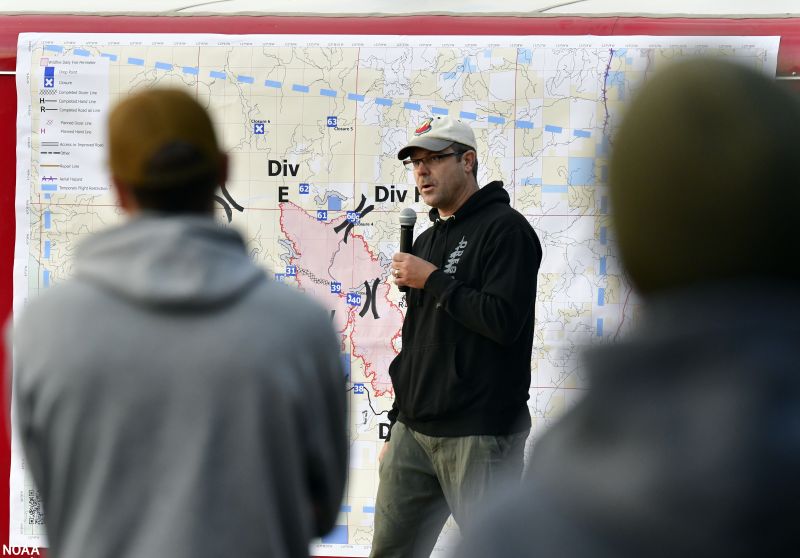
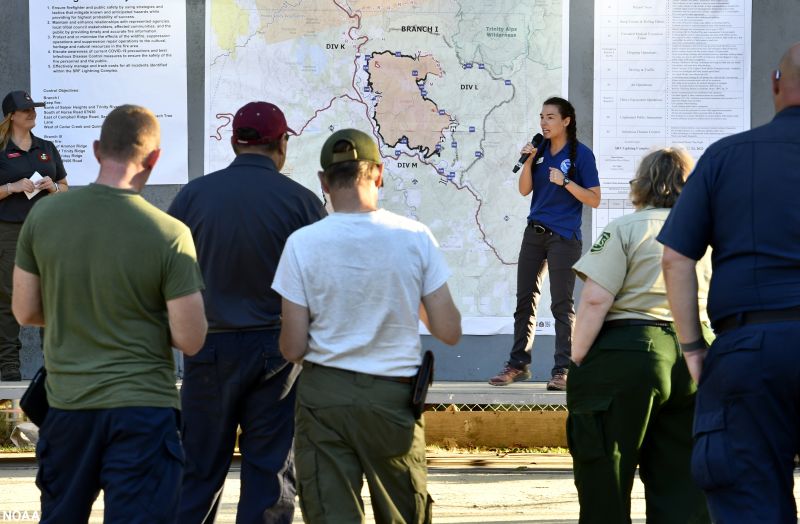
To date, the U.S. has seen more than 50,000 wildfires resulting in nearly seven million acres burned in 2022. Organizing resources and crews to fight wildfires is an enormous undertaking. Today, more than 15,000 wildland firefighters and support personnel are assigned to wildfire incidents across the country. Among the crews are specially trained meteorologists with NOAA’s National Weather Service (NWS), called Incident Meteorologists (IMETs).
When there is a large wildfire, an IMET is often deployed to the fire incident command post. IMETs provide critical fire weather information to wildfire management teams so they can map out the safest possible tactics for firefighters, while also generating immediate and short-term spot forecasts needed for fire suppression. NOAA has approximately 100 IMETs and IMET trainees that are stationed at NWS forecast offices throughout the country, ready to deploy.
We captured IMETs in action at several wildfires in the West during the last two weeks of August, 2022. Take a visual journey with NOAA’s IMETs as they travel to the fire line to provide critical weather data.
[ Back to Top ]


From NASA Jet Propulsion Laboratory at https://www.jpl.nasa.gov/news/nasas-lunar-flashlight-ready-to-search-for-the-moons-water-ice
Set for a November launch, the small satellite mission will use lasers to search for water ice inside the darkest craters at the Moon’s South Pole.
It’s known that water ice exists below the lunar regolith (broken rock and dust), but scientists don’t yet understand whether surface ice frost covers the floors inside these cold craters. To find out, NASA is sending Lunar Flashlight, a small satellite (or SmallSat) no larger than a briefcase. Swooping low over the lunar South Pole, it will use lasers to shed light on these dark craters – much like a prospector looking for hidden treasure by shining a flashlight into a cave. The mission will launch aboard a SpaceX Falcon 9 rocket in November.
"This launch will put the satellite on a trajectory that will take about three months to reach its science orbit," said John Baker, the mission's project manager at NASA's Jet Propulsion Laboratory in Southern California. "Then Lunar Flashlight will try to find water ice on the surface of the Moon in places that nobody else has been able to look."
[ Back to Top ]
From NASA Jet Propulsion Laboratory at https://www.jpl.nasa.gov/news/methane-super-emitters-mapped-by-nasas-new-earth-space-mission
October 25, 2022
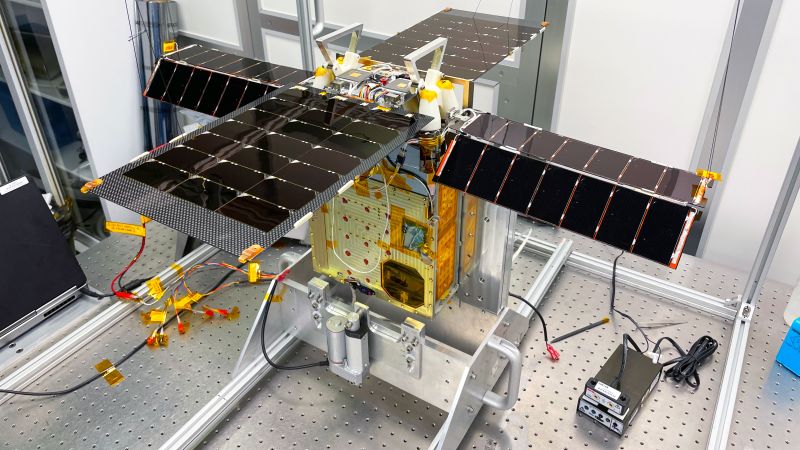
Built to help scientists understand how dust affects climate, the Earth Surface Mineral Dust Source Investigation can also pinpoint emissions of the potent greenhouse gas.
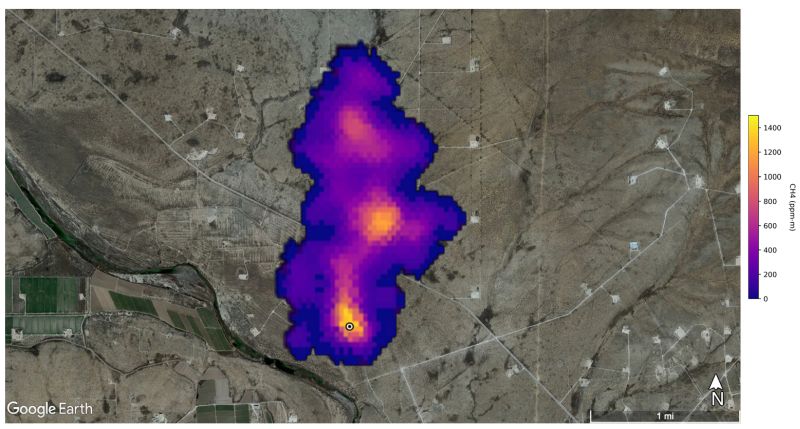
NASA’s Earth Surface Mineral Dust Source Investigation (EMIT) mission is mapping the prevalence of key minerals in the planet’s dust-producing deserts – information that will advance our understanding of airborne dust’s effects on climate. But EMIT has demonstrated another crucial capability: detecting the presence of methane, a potent greenhouse gas.
In the data EMIT has collected since being installed on the International Space Station in July, the science team has identified more than 50 "super-emitters" in Central Asia, the Middle East, and the Southwestern United States. Super-emitters are facilities, equipment, and other infrastructure, typically in the fossil-fuel, waste, or agriculture sectors, that emit methane at high rates.
"Reining in methane emissions is key to limiting global warming. This exciting new development will not only help researchers better pinpoint where methane leaks are coming from, but also provide insight on how they can be addressed – quickly," said NASA Administrator Bill Nelson. "The International Space Station and NASA's more than two dozen satellites and instruments in space have long been invaluable in determining changes to the Earth's climate. EMIT is proving to be a critical tool in our toolbox to measure this potent greenhouse gas – and stop it at the source."
Methane absorbs infrared light in a unique pattern – called a spectral fingerprint – that EMIT’s imaging spectrometer can discern with high accuracy and precision. The instrument can also measure carbon dioxide.
[ Back to Top ]
From NASA Jet Propulsion Laboratory at https://www.jpl.nasa.gov/news/nasas-insight-lander-detects-stunning-meteoroid-impact-on-mars
October 27, 2022
The agency’s lander felt the ground shake during the impact while cameras aboard the Mars Reconnaissance Orbiter spotted the yawning new crater from space.
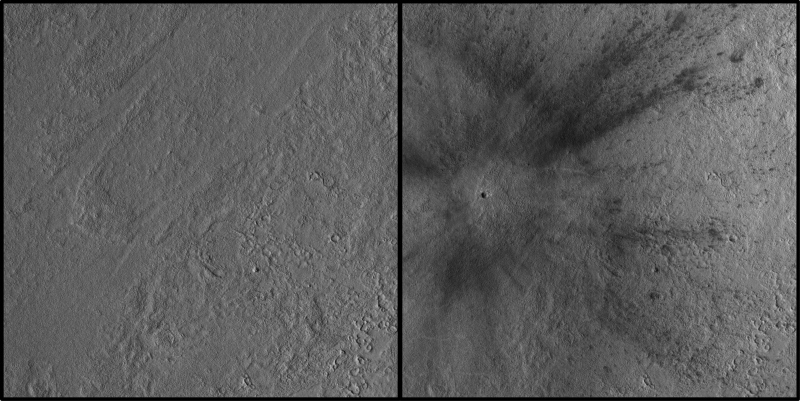
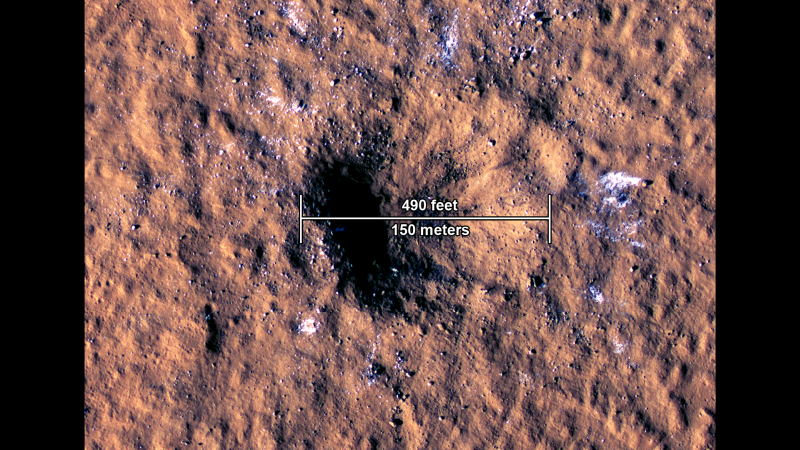
NASA’s InSight lander recorded a magnitude 4 marsquake last Dec. 24, but scientists learned only later the cause of that quake: a meteoroid strike estimated to be one of the biggest seen on Mars since NASA began exploring the cosmos. What’s more, the meteoroid excavated boulder-size chunks of ice buried closer to the Martian equator than ever found before – a discovery with implications for NASA’s future plans to send astronauts to the Red Planet.
Scientists determined the quake resulted from a meteoroid impact when they looked at before-and-after images from NASA’s Mars Reconnaissance Orbiter (MRO) and spotted a new, yawning crater. Offering a rare opportunity to see how a large impact shook the ground on Mars, the event and its effects are detailed in two papers published Thursday, Oct. 27, in the journal Science.
The meteoroid is estimated to have spanned 16 to 39 feet (5 to 12 meters) – small enough that it would have burned up in Earth’s atmosphere, but not in Mars’ thin atmosphere, which is just 1% as dense as our planet’s. The impact, in a region called Amazonis Planitia, blasted a crater roughly 492 feet (150 meters) across and 70 feet (21 meters) deep. Some of the ejecta thrown by the impact flew as far as 23 miles (37 kilometers) away.
[ Back to Top ]


From NOAA NESDIS Education at https://www.nesdis.noaa.gov/about/k-12-education/jpss-education?page=0
The Joint Polar Satellite System (JPSS) provides STEM activities and lessons to teach K-12 students and the general public about how and why polar-orbiting weather satellites observe Earth and its atmosphere.
The Web site offers at least 20 different lesson plans and activities, especially featuring the JP Super Seal Activity Book and the Factsheet: What is JPSS? There are games; activities for making, modeling, and measuring; a coloring page and even a comic.
Check it out today! https://www.nesdis.noaa.gov/about/k-12-education/jpss-education?page=0
[ Back to Top ]

Chloro-fluoro-carbon refrigerants (CFCs) were invented in 1928. It was more than four decades later that the impact of CFCs on stratospheric ozone was described. It was another decade before commercial enterprises began replacing CFCs with more environment-friendly materials. In 1987, the Montreal Protocol predicted that a similar global response would return upper atmospohere ozone to 1980 levels by 2070 -- that's another half century into our future. What is our status in 2022? Is the area of thinning ozone over Antarctica changing? Is it increasing or decreasing? In this lesson, students use satellite imagery to explore the Antarctic ozone hole. Download and display satellite imagery of stratospheric ozone. Measure the area of the thinning ozone using computer image processing tools. Graph the changes over a period of years. Extend the analysis to investigate ozone in other geographic areas and the relationship between ozone and other environmental factors.
| Grade Level: | 7-12 |
| Time Requirement: | 1-3 class periods |
| Prerequisites: | None |
| Relevant Disciplines: | Earth Science, Chemistry, Biology, Geography |
[ Back to Top ]
Share your satellite-based lesson ideas with the teaching community.
Send us a full lesson plan, or simply suggest a lesson idea. If you found the idea online, please share the source as well. The lesson can be about anything that helps connect learners with satellite-based technology - any grade level K-12 - any STEM subject area or geography.
"Satellite-technology" includes any part of the science, math, engineering, or technology of satellites, rockets, and remote sensing instruments as well as the use of any environmental satellite data to explore questions related to aspects of global change and local impacts in the long term, short term, and catastrophic time frames. Of special interest are lessons providing opportunities for learners to inquire, experiment, and apply mathematics.
Perhaps you designed a lesson yourself - we will happily prepare it for future publication in More Lessons from the Sky and inclusion in the SEA Lesson Plan Library. Perhaps you found a worthy lesson plan published elsewhere - we can research it inclusion in a lesson plan spotlight. In either case, you will receive full credit for developing and/or bringing the lesson to the attention of the teaching community. Don't forget to share your insights if you tried the lesson with students.
Please share your ideas at SEA.Lessons@SatEd.org.
[ Back to Top ]

![]()

This edition of the SEA Newsletter was produced in HTML5.
It is best viewed with most recent updates of Firefox, Edge, Chrome, Opera, or Safari.
©Satellite Educators Association, Inc. https://SatEd.org SEA.Newsletter@SatEd.org
Satellite Educators Association, Inc. is a 501(c)(3) non-profit educational organization.
The SEA Newsletter is published on-line monthly except January and August and available at no cost.
SEA terms, conditions, policies, and contact information are detailed HERE.
Unless otherwise listed, all photo and image credits are the authors of the articles.
Any opinons expressed in this Newsletter are those of the authors
and not necessarily those of the Satellite Educators Association, Inc.
or any of its officers, members, or representatives.
Many SEA Newsletter items contain third-party links to sites not governed by Satellite
Educators Association, Inc. The viewer is cautioned to be aware of the terms of use and
privacy policies for those third-party sites.
![]()
