OUR VISION
The world's finest educators supporting science, technology, engineering, and math (STEM) learning for pre-kindergarten to post-graduate students using real-world applications from satellites and satellite data.
OUR MISSION
To enhance the education environment to excite students about science, technology, engineering, and math through space-based technology -- satellites and satellite data.

Eleanor Roosevelt

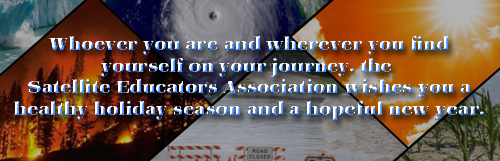
Your days are numbered. Use them to throw open the windows of your soul to the sun. If you do not, the sun will soon set, and you with it.
Marcus Aurelius

TABLE OF CONTENTS
Click a RED link to view article
Association News
Input from Ron
John's Journey
Satellites with Ed
Special Reports
Earth's Hydrosphere
In the News
For Teachers
More Lessons
from the Sky

Recently, I was treated to a ride in a new Tesla Model Y. One of the key characteristics of this all electric vehicle is the dashboard-mounted 17" computer monitor that displays everything that the driver needs to know about the car. It even has an animated feature that depicts the car (with the correct exterior color) moving down the street with other vehicles in their correct positions nearby as well as traffic lights and even pedestrians in close proximity. The animated car in the display also shows head and tail lights, brake lights and turn indicators when activated. Now, a little more digging into the deeper recesses of "entertainment" included in the same computer programming unearthed some seasonal options to the normal display. During December, the driver can choose to have the vehicle displayed as Santa's sleigh pulled by two reindeer. Of course, the sleigh has tail and brake lights. When a turn signal is on, the collar on the reindeer on that side also flashes red in the display. Of course, the built-in "entertainment" is meant for passenger-viewing only while the driver concentrates on safely driving the automobile.
On a less fanciful note, NASA's Earth Observatory provides us with a view from Landsat 9 of cranberry bogs in Massachusetts, a state that "has a long-standing relationship with one of Thanksgiving's iconic foods -- the cranberry." Many enjoy a cranberry garnish with their traditional holiday turkey dinner whether the cranberry's are cooked, ground into relish with other fruit, their juices gelled, or prepared a different way. The image below shows part of Massachusetts, a state that produces about 33% of cranberries harvested in the United States. Wisconsin accounts for more than 50%. Cranberries are also produced in New Jersey, Oregon, and Washington. Nonetheless, this image seems an appropriate way of saying thanks to all the cranberry growers and extending SEA's very best wishes to you and yours for a wonder-filled holiday season!
--Pete Arvedson
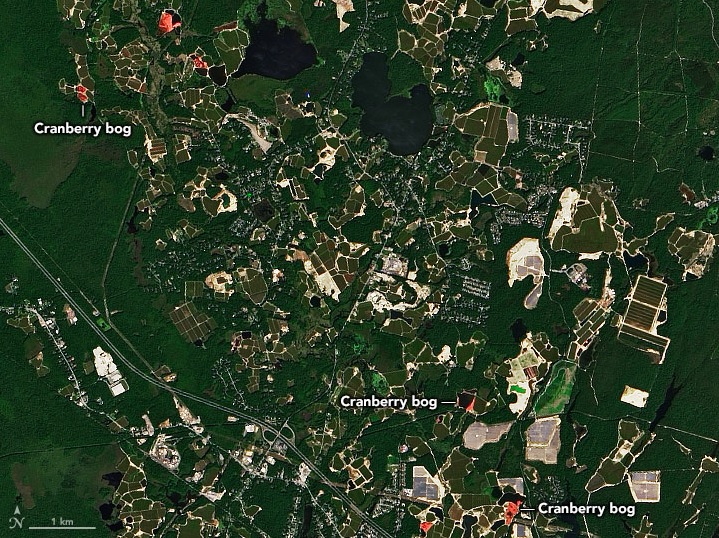
See the full story at https://earthobservatory.nasa.gov/images/150643/cranberry-bogs-in-plymouth-county.

[ Back to Top ]
The SEA Newsletter will begin quarterly publication (four times per year) in 2023. The newsletter will be posted for reading in March, June, September, and December next year. This is a change for the almost-monthly publication (each month except January and August) enjoyed since 2007. The SEA Newsletter is a major communication arm of the Satellite Educators Association bringing education and aerospace news to SEA members and interested individuals. It features several regular expert columnists as well as a review of relevant items from NASA, NOAA, the aerospace industry, and the education community. And, don't forget the spotlights on the annually updated K-12 lesson modules available in the SEA Lesson Library.
The SEA Newsletter has its roots in a printed-and-mailed version called InfoSEA published by Nancy McIntyre's Educational Center for Earth Observations at West Chester University, Pennsylvania, starting in the mid-1990s. With the closing of Nancy's office in 2001, InfoSEA and the fledgling SEA Web site ended. SEA moved the Satellites & Education Conference to California State University, Los Angeles and initiated the M.Y. S.P.A.C.E. Program in 2002. (See SEA History.)
Vic Everett stepped up as SEA's new Web Administrator and inaugurated the SatEd.org Web site in 2004. The new, online version of the SEA Newsletter was created several years later. On Vic's passing in 2015, Pete Arvedson offered temporary help to keep the Newsletter afloat until a new editor was found. Now, it is time for him to step back; the December 2022 edition will be Pete's last monthly issue as Editor although he will continue to help during the transition to a quarterly format in 2023 while the SEA Executive Committee selects a new Newsletter Editor.
The Newsletter Editor's most important role is gathering and arranging items for inclusion in each issue. The publication of the newsletter will still be handled by the SEA Web Manager once materials are received from the Editor.
Anyone who would like to enjoy helping the Newsletter Committee or serving as Editor, please contact the SEA Executive Committee at SEA.Newsletter@SatEd.org.
[ Back to Top ]


By Ron Gird, Meteorologist and former Satellite/Spaceflight and Outreach Program Manager for the National Weather Service
Hi Folks.
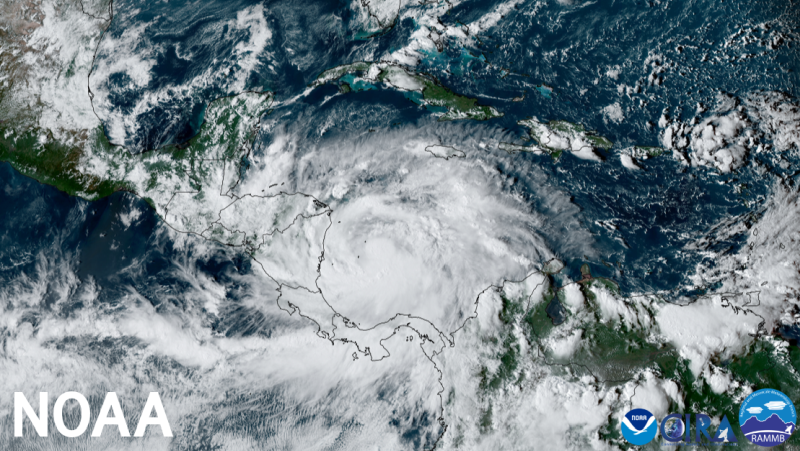
Climate change continues to impact us with warmer weather, extended drought, and increased hurricane intensity. Here is a summary of NOAA's monthly climate report. How is it related to other articles in this month's SEA Newsletter? -Ron
From NOAA News & Features at https://www.noaa.gov/news/earth-had-its-4th-warmest-october-on-record"
November 15, 2022
The planet added another warm month to a warm year, with October 2022 ranking as the world’s fourth-warmest October in 143 years.
Notably, the Northern Hemisphere saw its second-warmest October and Europe saw its warmest October on record, according to scientists from NOAA’s National Centers for Environmental Information (NCEI).
Below are more highlights from NOAA’s October global climate report:
The average global temperature for October was 1.60 degrees F (0.89 of a degree C) above the 20th-century average of 57.1 degrees F (14.0 degrees C), ranking as the world’s fourth-warmest October on record behind 2015 (warmest), 2019 (second warmest) and 2018 (third warmest).
Looking regionally, the Northern Hemisphere had its second-warmest October on record, just behind October 2015. Europe had its warmest October on record, Africa tied 2003 for its third-warmest October, while North America and Asia each had their sixth-warmest Octobers on record.
Last month was the 46th consecutive October and the 454th consecutive month with temperatures above the 20th-century average.
The YTD average global temperature was the sixth warmest on record at 1.57 degrees F (0.87 of a degree C) above the 20th-century average.
[ Back to Top ]


By John D. Moore, Executive Director, Institute for Earth Observations at Palmyra Cove, New Jersey
Here we are coming to the close of 2022! As we look forward into 2023, I think we are in an extremely exciting time of space related initiatives providing essential information, data, and imagery that impact our daily lives, and, of course, that impact significantly contributes to finding solutions to planet-wide issues. From the rapid expansion of Earth Observing Satellites, a return to the Moon, and the push forward to Mars, there has not been a more exciting time for the space program since the 1960’s. As more and more countries enter space, space policies and practices become much more complex. The necessity to adequately prepare the next generation of STEM professionals has never been more important.
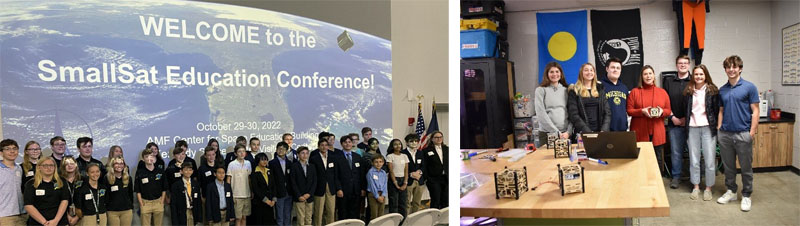
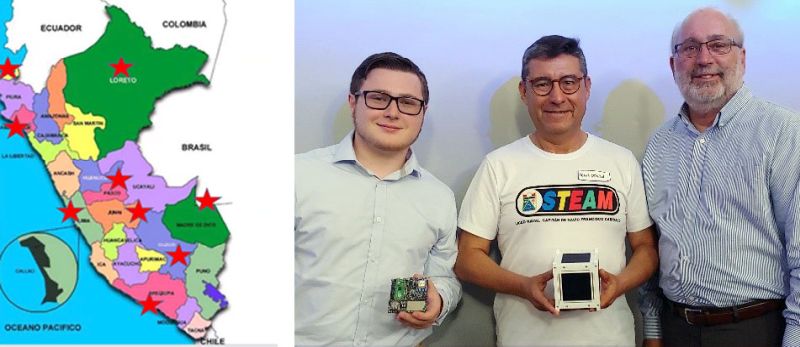
I attended and presented the A3Sat project at the inaugural SmallSat Education Conference in late October. The conference was a huge success with more than 275 attendees. Having a conference at the Kennedy Space Center, was very inspiring and, of course, only bolstered an already significant air of legitimacy for this conference. Reminiscent of the underlying M.Y.S.P.A.C.E. Program goals of bringing students together collaboration to learn from each other, the conference presentations were highly focused on student's works and achievements. Presentations ranged from our A3Sat Emulator to the students from Weis School (FL) who actually built and launched CubeSats into space. Students from the Stockbridge School in Michigan were in attendance as well. Stockbridge was an early pilot site for the A3Sat Emulator. Since that time, they have made modifications, flown a HAB and are working with middle school students in their district. I am proud to have them as a part of our team building their "QB Sat" initiative. Building this new community of young talent is not only exciting, but necessary as the new Space Ecosystem emerges. The full conference program is still online at https://www.smallsateducation.org/.
The "CubeSats in Peru" collaboration is scheduled to begin January 2023 and will be entirely in Spanish. This is a national effort in Peru is supported by three Peruvian organizations: Engitronic, CONYTEC, and STEAM WORLD. Representatives of the Peruvian teams were able to attend the SmallSat Education Conference via Zoom. This is yet another example of using the A3Sat Project for the purpose of teachers and students coming together to empower students, the Next Generation of STEM Professionals, developing Career and Technical Skills inspired by aerospace. The A3Sat Emulator will be used as the instructional tool introducing teachers and students to CubeSat design, concepts and practice of "Acquiring - Analyzing - Applying" data and/or imagery whether it be from Earth, the Moon, or Mars! The A3Sat Project is building similar relationships and initiatives with the Kenya Space Agency and GLOBE Kenya.

On Saturday evening, while at the SmallSat Education Conference, there was a Cape Canaveral Section AIAA meeting at Coca Beach. Representatives from the US Space Force were in attendance because of their launch that took place the on November 8, 2022. The speaker for the evening was Mr. Bontrager, the Technical Director for Launch and Range Operations of Space Systems Command at Cape Canaveral Space Force Station, Florida. Launch and Range Operations provides policy, guidance, and resources for all US Space Force launch and range operations including integration of operational priorities, system readiness, manifesting, and mission partner support across the Department of Defense and the inter-agency. A question from the audience asked about the number and frequency of launches that could be expected from the Florida Space Coast in the future. The response was astounding: perhaps as many as 100 per year!
As 2022 comes to an end, I believe we are about to "launch" into a new era, building on decades of experience in education, technology, and space. Through the longevity of SEA, we have faced all of these issues head on, and perhaps there has never been a more important time to do what we do best, educate the next generation of STEM professionals. Many thanks
to Pete and Paula Arvedson for yet another year of hard work, and thanks to the Executive Committee for dedicating their time to keep SEA moving forward.
The journey is not yet over! I'm holding on to my dreams, to study the Earth from Space. Who knows? It could be very interesting John’s Journey 2023!
Happy Holidays and best wishes to all for a healthy and productive new year.
Remember - "you can teach anything with satellites."
Stay safe - stay well!
For now, I'm John...and this is my Journey
[ Back to Top ]

By Edward Murashie, President, ProEngineered Solutions
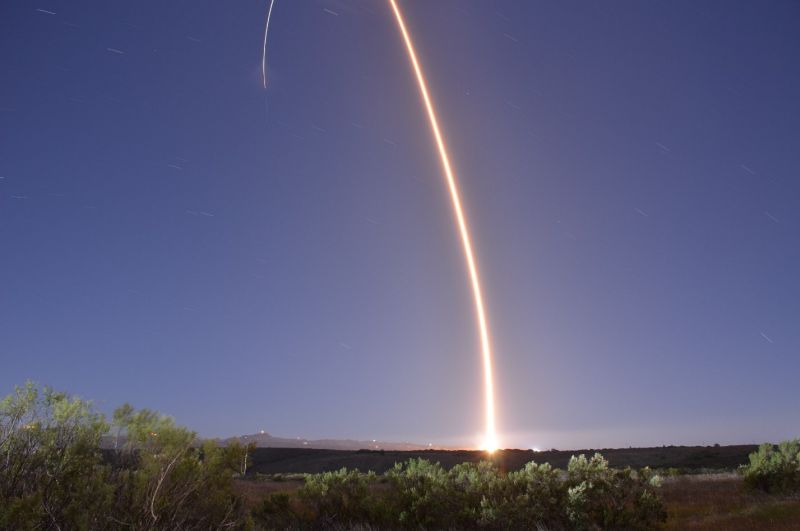
Having previously explained the Joint Polar Satellite System (JPSS-2) weather satellite, and the Low Earth Orbit Flight Test of an Inflatable Decelerator (LOFTID), I am glad to report that both were successfully launched on-board an Atlas V rocket on November 10th at 1:49am local time. As the countdown progressed, there was a ground valve issue which added a little drama for those of us watching. Luckily it was resolved before the launch window timeframe closed. The rocket placed JPSS-2 in the proper orbit and released LOFTID, which later splashed down and was recovered. JPSS-2’s solar panel only partially deployed, fortunately enough to give it "positive power" while the engineers worked the problem. 14 hours later the problem was resolved and now the spacecraft’s status is "healthy and operating as expected" while it goes through its checkout phase.
In previous articles I have explained the two types of satellite orbits around the Earth, polar and geostationary orbits. Newton’s first law says that an object in motion stays in motion in a straight line unless acted upon by another force. In the case of a satellite, that force is the Earth’s gravity. The closer a satellite is to Earth, the more Earth gravitational force is exerted on it and the faster it must travel to remain in the same orbit. For example, a polar orbit satellite at 512 miles altitude travels at approximately 16,600 miles per hour and orbits the Earth every 101.4 minutes. A geostationary satellite at 22,000 miles altitude travels at approximately 6,800 miles per hour and orbits the Earth every 24 hours.
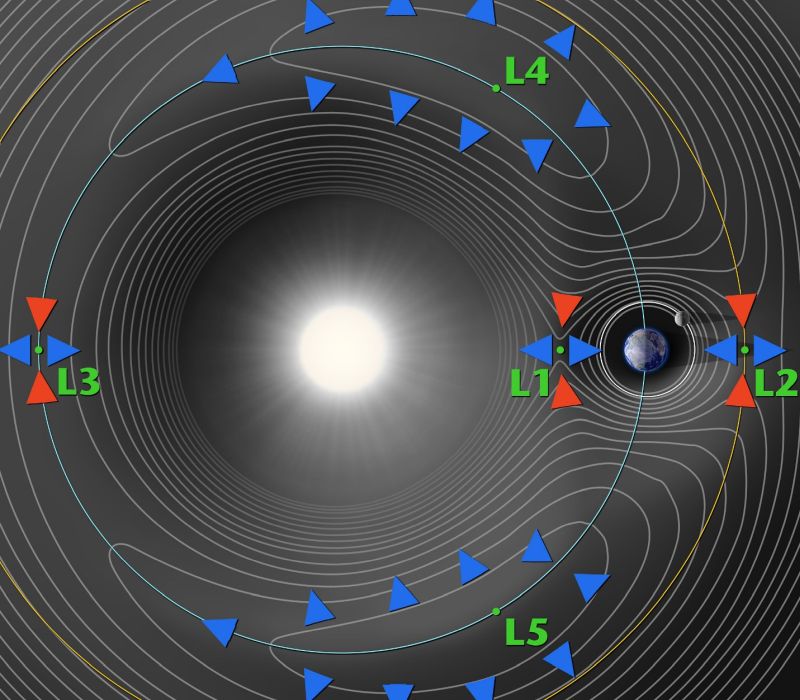
What if there were locations in space where the Sun’s and Earth’s combined gravitational forces balanced the outward centrifugal force away from the sun? That way if you place a satellite at one of these points it would just stay in that relative location rotating around the sun with the Earth.
Looking at NASA’s gravitational plot below, we see lines of equal gravitational force and five such locations where the forces are balanced. These locations are named Lagrange Points L1, L2, L3, L4, and L5. L1, L2 and L3 were discovered by mathematician Leonhard Euler around 1750 and L4 and L5 were discovered by mathematician Joseph-Louis Lagrange around 1772. L1, L2 and L3 are considered unstable as compared to L4 and L5 because small movements in the blue arrow directions would cause an object to quickly move out of orbit.
Another helpful 3D visualization and explanation is available from YouTuber It’s Just Astronomical!
Earth observational satellites are placed in polar orbits around the north and south poles so that they can image every location on the Earth twice a day. They are also placed in geostationary orbits around the equator so that they remain at the same longitude at the equator and make one revolution per day. But are satellites placed at Lagrange Points? Yes, they are!
Satellites are placed at Lagrange Points for several reasons.
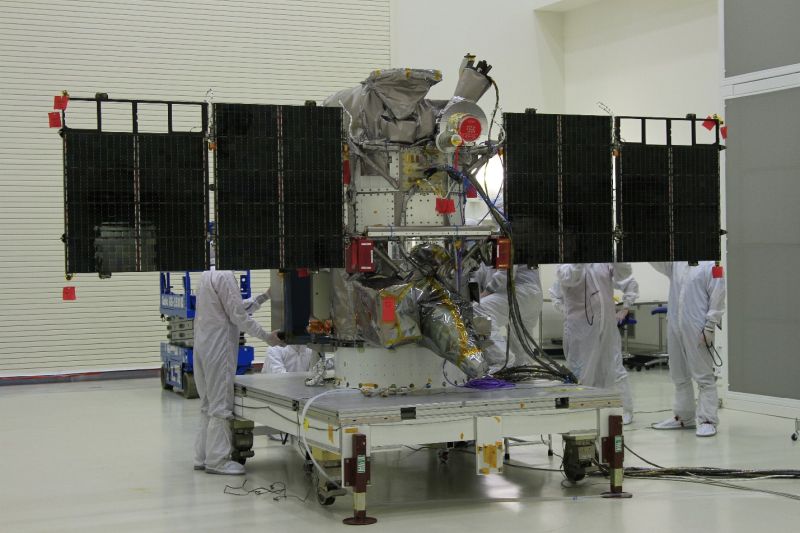
Vice President Al Gore had a dream in 1998 to place a satellite at the L1 Lagrange Point where it would send images of the sunlit Earth 24 hours a day and be made available on the Internet. It would also have an instrument that would measure and compare the Earth’s reflected solar energy to the absorbed solar energy. Construction of the satellite started, and it was named Triana after the first person on Christopher Columbus' crew who spotted the New World, Rodrigo de Triana.
In 2001, after George W. Bush was sworn in as president, the project was stalled because of enormous space shuttle cost overrun concerns. The $100 million satellite was placed in storage. In 2003 the project was revisited, the satellite was renamed DSCOVR, but the project continued to be on hold. One congressman was heard saying "This idea supposedly came from a dream. Well, I once dreamed I caught a 10-foot bass. But I didn't call up the Fish and Wildlife Service and ask them to spend $30 million to make sure it happened."
Fortunately, in 2008 a committee realized the satellite would meet the National Oceanic and Atmospheric Administration's and the United States Air Force's need for monitoring space weather. DOSCVR met the need to warn forecasters about solar flares and geomagnetic storms. Being nearly a million miles from Earth allows forecasters to be warned 15 to 60 minutes before a solar storm hits the Earth. This gives time to safe satellites, alert the astronauts on board the International Space Station, and prepare the power grids on Earth. Also being further away from the Earth magnetic influence allows for accurate readings as compared to the GOES satellite’s space weather monitoring systems.
The satellite was removed from storage, still in excellent condition, and a few components like the imager were modified. The satellite was launched on a SpaceX Falcon 9 from Cape Canaveral on February 11, 2015 and it reached its L1 Lagrange Point 100 days later.
There have been threats to DSCOVR since its launch, including a hardware failure in 2019 which was mitigated through software in 2020. It also faced a financial threat when the US House of Representatives proposed budget cuts in 2017 and 2018 which the Senate had turned down. As of now the satellite and the program are still operational.
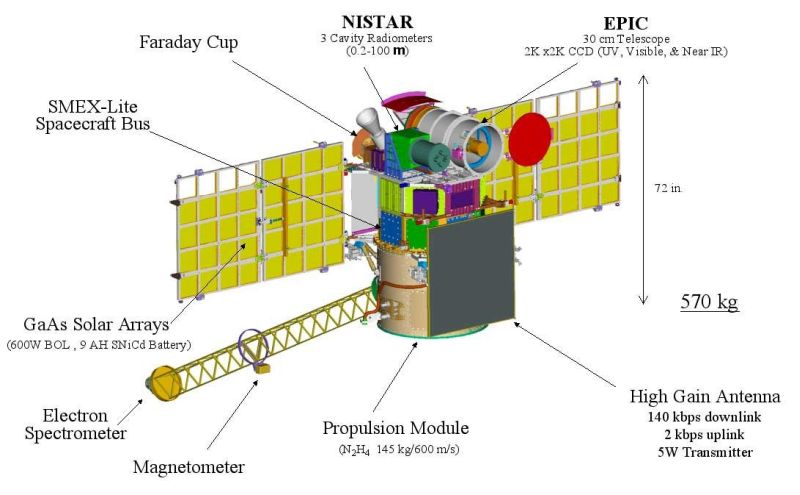
24x24 Km resolution is not impressive especially after seeing GOES images with up to 0.5 Km resolution. But what you will never see in a GOES image is the backside of the moon. We never get to see the backside of the moon while on Earth, as it is always facing away from us. But with DSCOVR a million miles away and the moon a quarter million miles away, we get to see DSCOVER images with the moon between it and the Earth, and the Earth between it and the moon.
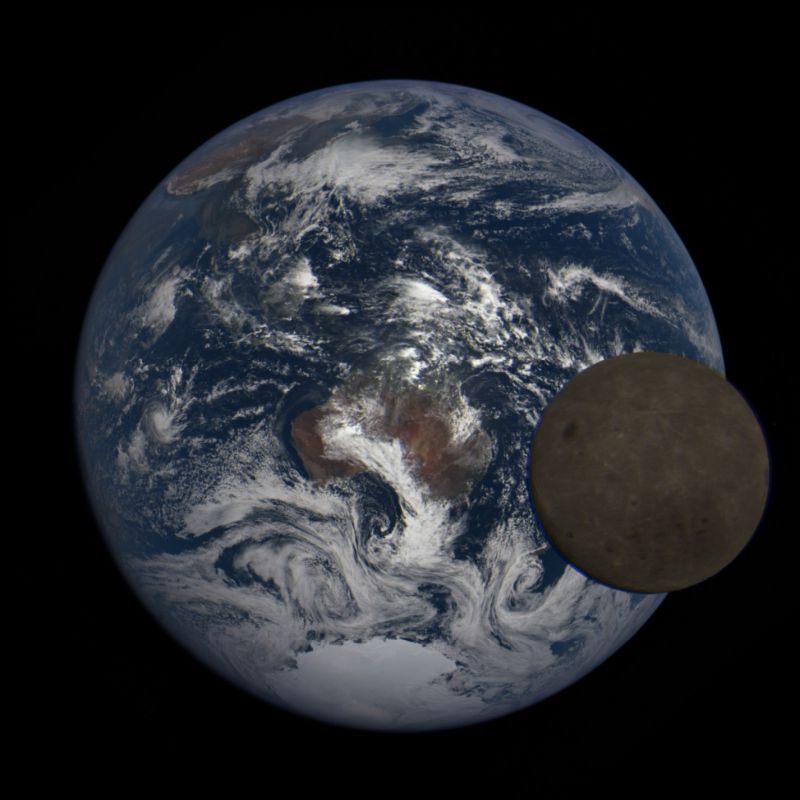
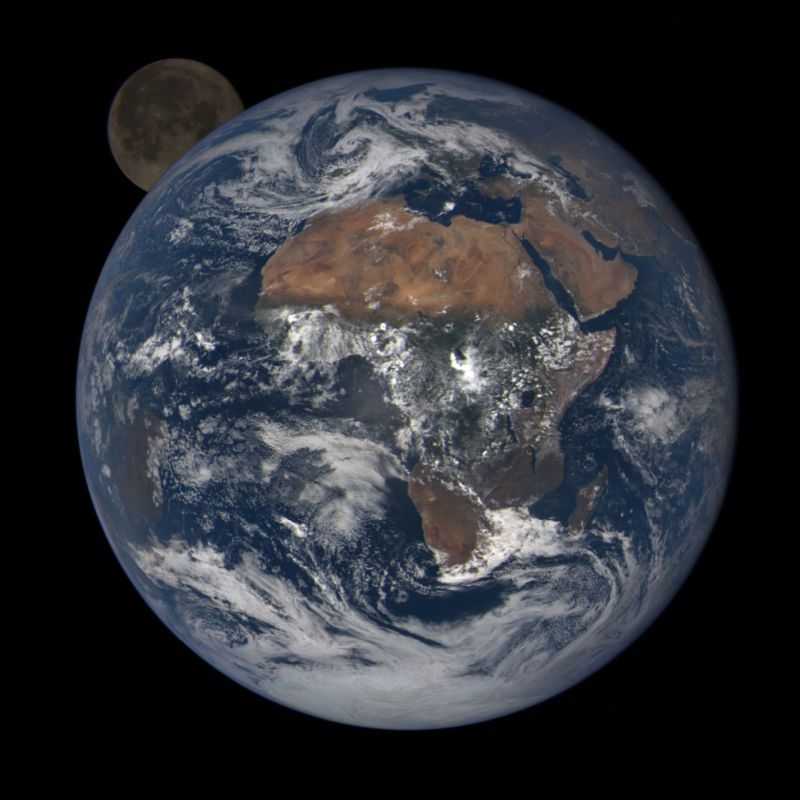
Amazing images!
For more information, you might like to check out these sites:
If you have any questions please email me at eamurashie at gmail dot com.
[ Back to Top ]


The Special Reports section will focus on items related to a specific topic of current interest.
In this edition, we look at the Earth's hydrosphere, that is, water on the Earth's surface and in the atmosphere.
What's happening? Massive amounts of water blown into the atmosphere by volcanic explosion; rising sea levels; intensifying hurricanes; and extreme La Niña events. What tools and technologies are being used for monitoring and forecasting? A new array of smallsats providing hourly reports of severe storms; a new satellite-based survey of Earth's surface water that includes, for the first time, not just oceans but rivers and lakes as well; and JPSS-2 reaching operational orbit and renamed NOAA 21. What solutions are available, if any?
From NASA's Jet Propulsion Laboratory at https://www.jpl.nasa.gov/news/tonga-eruption-blasted-unprecedented-amount-of-water-into-stratosphere
August 2, 2022
The huge amount of water vapor hurled into the atmosphere, as detected by NASA’s Microwave Limb Sounder, could end up temporarily warming Earth’s surface.
[ Back to Top ]
From NASA's Jet Propulsion Laboratory at https://www.jpl.nasa.gov/news/nasa-study-rising-sea-level-could-exceed-estimates-for-us-coasts
November 15, 2022
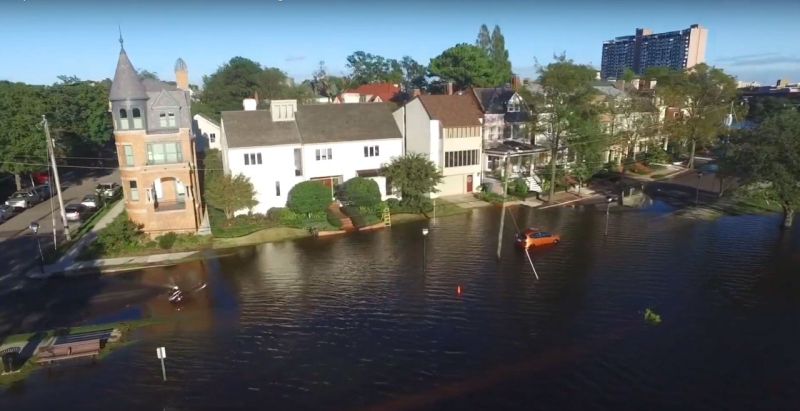
New results show average sea level rise approaching the 1-foot mark for most coastlines of the contiguous U.S. by 2050. The Gulf Coast and Southeast will see the most change.
[ Back to Top ]
From NOAA's Arlantic Oceanographic & Meteorological Laboratory at https://www.aoml.noaa.gov/news/atlantic-coast-hurricanes-intensifying-faster/
November 1, 2022
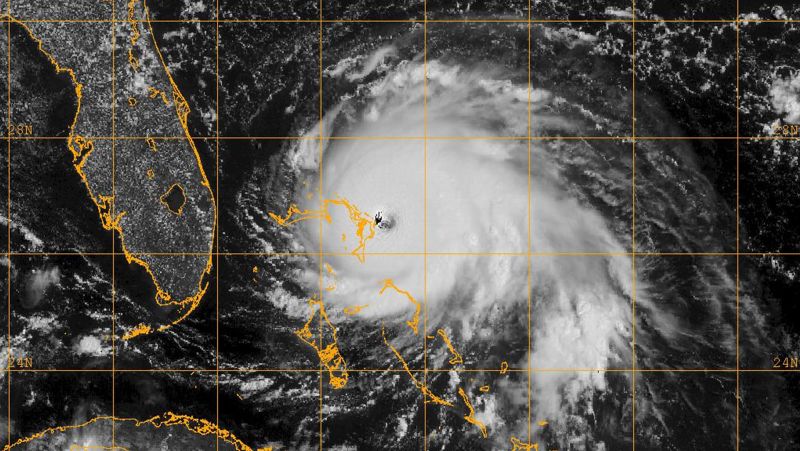
NNew NOAA research published in the journal Geophysical Research Letters, found that hurricane intensification rates near the U.S. Atlantic coast have increased significantly over the last 40 years and will likely continue to increase in the future.
[ Back to Top ]
By Nat Johnson from Climate.gov at https://www.climate.gov/news-features/blogs/another-winter-la-ni%C3%B1a%E2%80%99s-grip-%E2%80%93-november-update-noaas-2022-23-winter-outlook
November 22. 2022
While it’s a little intimidating to put on these oversized shoes, I’m forging ahead in an annual ENSO Blog tradition and giving you all the juicy details about NOAA’s Winter Outlook (1). Regular readers may remember that Mike Halpert of the NOAA Climate Prediction Center (CPC) has been the blog’s winter outlook guru for years, but following Mike’s retirement earlier this year, I’ll be leading you on this year’s journey (Mike, I will try to make you proud!). And maybe my job will be pretty easy this time, given that we are expecting a third consecutive winter with La Niña conditions in the tropical Pacific. What will that mean for this winter? Let’s find out!
[ Back to Top ]
Edited by Gerelle Dodson, NASA at https://www.nasa.gov/press-release/nasa-awards-launch-services-task-order-for-tropics-cubesats-mission
November 23, 2022
The TROPICS mission consists of four CubeSats intended for two low-Earth orbital planes and is part of NASA’s Earth System Science Pathfinder Program. Rocket Lab will launch the TROPICS satellites into their operational orbits during a 60-day period (first insertion to final insertion). These two dedicated Federal Aviation Administration (FAA) licensed launches, each on an Electron Rocket are targeted to launch no earlier than May 1, 2023, enabling NASA to provide observations during the 2023 Atlantic hurricane season, which begins June 1.
[ Back to Top ]
From NASA's Jet Propulsion Laboratory at https://swot.jpl.nasa.gov/news/76/nasas-surface-water-satellite-to-launch-thursday-dec-15/
Dece,ber 1, 2022
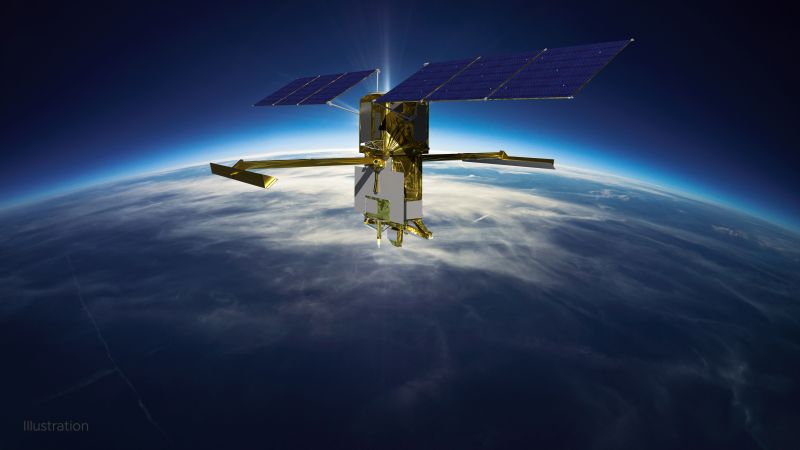
NASA, the French space agency Centre National d’Études Spatiales, and SpaceX are now targeting 3:46 a.m. PST Thursday, Dec.15, for the launch of the Surface Water and Ocean Topography (SWOT) satellite. The new date allows for additional time to complete prelaunch processing and checkouts of the SpaceX Falcon 9 rocket.
SWOT will be NASA’s first global survey of nearly all water on Earth’s surface. Scientists plan to use its observations to better understand the global water cycle, furnish insight into the ocean’s role in how climate change unfolds, and provide a global inventory of water resources.
[ Back to Top ]
From NOAA National Environmental Satellite Data and Information Service at https://www.nesdis.noaa.gov/news/jpss-2-has-new-name-noaa-21
November 21, 2022
.jpg)
NOAA’s JPSS-2 satellite successfully launched from Vandenberg Space Force Base on Nov. 10 at 1:49 a.m. PST. This week, it was officially renamed NOAA-21.
The Joint Polar Satellite System (JPSS) series of satellites provides the latest advancement in observations gathered from a polar orbit. In the past, NOAA's polar-orbiting satellites were each assigned a letter (-A, -B, -C, etc.) as they were being designed, built, and launched. Then, once each satellite reached orbit, they were renamed and assigned a number. For example, the polar-orbiting satellite, NOAA-H, launched on September 24, 1988. When it reached polar orbit, it became known as NOAA-11.
[ Back to Top ]


From NOAA Research News at https://research.noaa.gov/article/ArtMID/587/ArticleID/2914/No-sign-of-significant-decrease-in-global-CO2-emissions
November 14, 2022
Global carbon dioxide emissions in 2022 remain at record levels and natural carbon sinks are being impacted by climate change, according to a report published last week by the Global Carbon Project.
The publication, produced by an international team of more than 100 scientists including many experts from NOAA, projects that atmospheric CO2 concentrations will reach an average of 417.2 parts per million in 2022, more than 50 percent above pre-industrial levels. The projection of 40.6 billion tonnes of CO2 emissions in 2022 is close to the 40.9 billion tonnes of CO2 noted in 2019, which is the highest annual total ever recorded.
[ Back to Top ]
From NASA ICESat-2 at https://www.nasa.gov/feature/esnt/2022/phytoplankton-may-be-abundant-under-antarctic-sea-ice-study-suggests
November 28, 2022
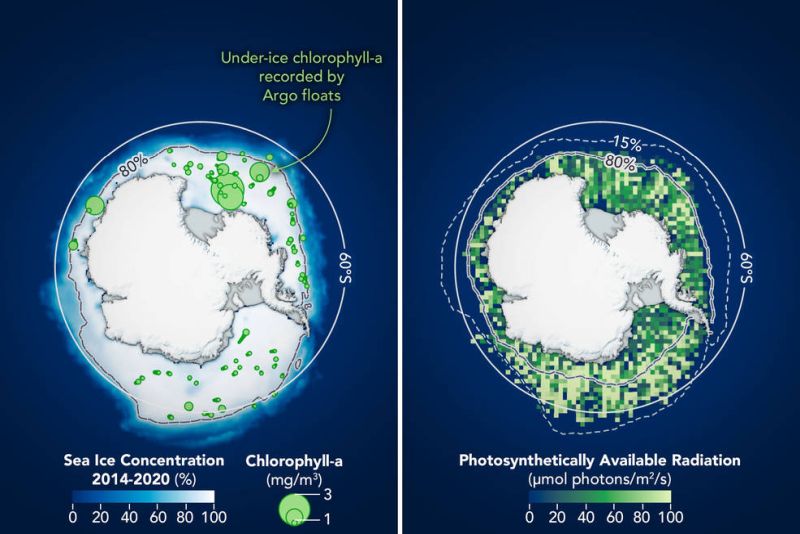
A decade ago, scientists on a NASA-sponsored ocean expedition found massive populations of phytoplankton blooming beneath sea ice in the Arctic Ocean. Now scientists using underwater instruments and a NASA satellite have found evidence of potentially significant blooms beneath the sea ice encircling Antarctica. The findings were recently published in the scientific journal Frontiers.
Phytoplankton are to the ocean what grasses are to land: these floating, plant-like organisms soak up sunshine, sponge up mineral nutrients, and create their own food (energy) through photosynthesis. Phytoplankton grow just about anywhere there are open, sunlit patches of ocean. When conditions are right, these collections of microscopic cells can blossom to scales that are visible from space. They are a critical food source for other life in the ocean and a key carbon recycler and disposer for the planet.
But until recent studies, the conventional wisdom was that ice cover prevented the growth of phytoplankton for most of the year in the ocean around Antarctica because very little sunlight could penetrate to the water below. However, new evidence shows there are just enough cracks, thin spots, and gaps to let sufficient daylight through the sea ice.
[ Back to Top ]
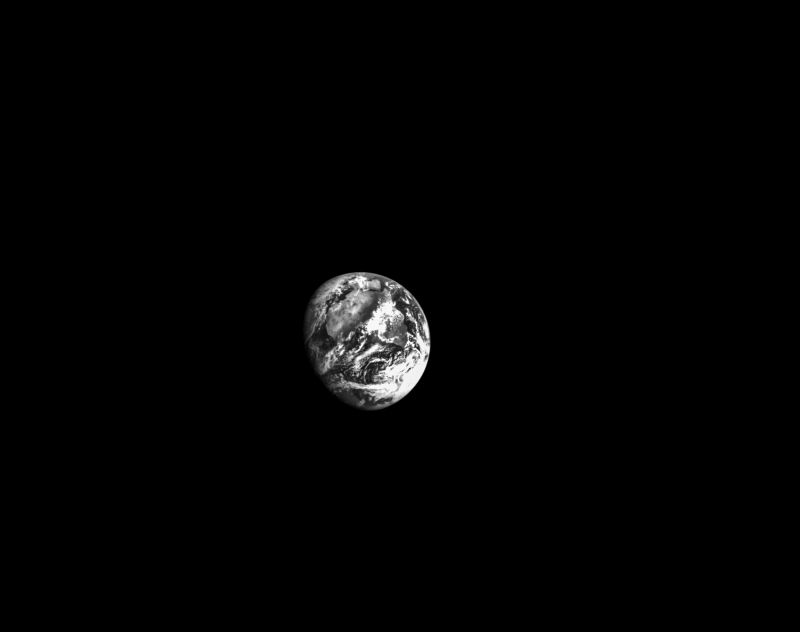
Eidted by Monika Luabeya for NASA Orion Spacecraft at https://www.nasa.gov/image-feature/orion-s-optical-navigation-camera-captures-earth
November 22, 2022
[ Back to Top ]


From NOAA NESDIS Education at https://www.nesdis.noaa.gov/about/k-12-education/jpss-education?page=0
The Joint Polar Satellite System (JPSS) provides STEM activities and lessons to teach K-12 students and the general public about how and why polar-orbiting weather satellites observe Earth and its atmosphere.
The Web site offers at least 20 different lesson plans and activities, especially featuring the JP Super Seal Activity Book and the Factsheet: What is JPSS? There are games; activities for making, modeling, and measuring; a coloring page and even a comic.
Check it out today! https://www.nesdis.noaa.gov/about/k-12-education/jpss-education?page=0
[ Back to Top ]
From NSTA at https://www.nsta.org/resources/freebies-and-opportunities-science-and-stem-teachers-november-29-2022?utm_medium=email&utm_source=rasa_io&utm_campaign=newsletter
November 29, 2022
It seems often true that quality teachers are the last to "blow their own horns" in recognition of the work they are doing. The National Science Teachers Association (NSTA) runs on its Web site an updated list of vetted, no-cost solutions and opportunities for teachers. This month, the list features A Guide to Noticing STEM Learning for early childhood teachers, Blue Apple Projects (project-based learning) for elementary and middle level teachers, and YouthAstroNet for middle level teachers. Listed opportunities include American Meteorological Society Summer Courses and National Teachers Hall of Fame for all K-12 teachers and National Society of High School Scholars Conference Grants for high school teachers.
Find descriptions, application deadlines, and links at HERE.
[ Back to Top ]
The U.S. education system — with its promise to educate all — has been a model for the world, but it faces unprecedented challenges. The teacher shortage has recently received national attention, but the issue has been building for years. It affects some regions more than others; districts that serve rural areas and/or low-income pupils; and specific subject matter. Some states have responded by lowering the qualifications for individuals to be employed as teachers. While this may be a short-term solution for localized teacher shortages, it will not solve the longer-term issues and will result in lower-quality education for students.
The solution to the teacher shortage crisis is not to fill classrooms with under qualified individuals. Instead, we must create a sustainable system that prepares, retains, and supports teachers through accessible, high-quality teacher preparation, competitive compensation, ample resources, and ongoing professional learning and mentoring opportunities. These commitments demonstrate that educators are professionals and are critical to our social infrastructure and progress as a nation. Their positive impact on their students helps to ensure that we have a vibrant society and skilled workforce in the future.
To create a sustainable system, we need to make teacher preparation rigorous and accessible through programs such as student loan forgiveness, compensating student teaching internships, and maintaining qualification standards. New educators deserve to enter the classroom prepared to teach so that they can be successful in their career and for their students.
We must retain teachers beyond their early career experience in order for them to be most effective. Students of teachers who have been in the classroom for longer periods of time have been shown to have better learning outcomes. In the last thirty years, the median years of experience has declined from fifteen years to less than three. Additionally, more inexperienced teachers are often clustered in schools that have higher percentages of students from underrepresented or underserved communities, as well as those in low-income, rural, or urban areas—an example of the uneven distribution of teacher shortages. So the problem is not merely one of supply. We must give support that teachers need to stay at these schools so their students benefit from having experienced teachers.
We already know solutions to retaining teachers once they enter the classroom based on schools and districts that do not have teacher shortages. Teachers need to be supported through mentoring, induction programs, and high-quality professional learning programs, all of which have been shown to increase retention. Teachers need to be compensated at a living and competitive wage, matching their education and professionalism. In a recent report from the National Educational Association, teachers' salaries averaged 19.2 percent lower when compared to other college-educated workers with similar characteristics.
Finally, educators need to be respected as professionals. They are facing the challenge of trying to help their students recover from substantial disruptions to the learning process during the past two years. Recently, teachers have been caught in the middle of ongoing political and cultural debates in our country. We need to treat and support teachers as the professionals they are through their development and the culture and environment in which they work — not in some schools, but in all schools. Not for some students in those schools, but for all students.
This statement was released by the National Science Teachers Association (NSTA) and at least 12 other professional organizations for teachers. See the the complete list with associated links HERE.
[ Back to Top ]


A covert military operation examines “intel” from images obtained using satellites and cameras on unmanned airplanes. A meteorologist at the National Severe Storm Laboratory in Norman, Oklahoma, analyzes a series of satellite images and other data to predict the path and potential for destruction of a mounting tropical storm in the Atlantic Ocean. A video cameraman records a report by a television journalist at the edge of a growing forest fire that is broadcast live to homes hundreds of miles away. A radiologist uses an x-ray to “see” the broken bone in a young child’s arm. A geologist working for a petroleum company studies a multispectral image from a Landsat satellite to determine the probable presence of subterranean gas and oil in a specific region. What do they all have in common? Remote sensing – using a sensor to detect changes in reflected light at a place other than one we can directly see with our own eyes. That is a loose definition, but the concept is not. Though some remote sensing shown in motion picture stories is fiction, the evolving technology is very real and increasingly accessible. During the more than half century since the first launch of an artificial satellite, the body of knowledge has grown immensely about which wavelengths of the electromagnetic spectrum are most reflected by which features of the Earth’s surface and components of the atmosphere. In this lesson, learners build a simple electronic light sensor that transmits a radio signal when activated by light. The transmitted signal is heard as an audible tone on any FM radio. The quality of the tone varies with the intensity of the light striking the sensor. Learners use the sensor to observe and measure the relative amount of light of various colors when reflected from different surfaces.
| Grade Level: | 9-12 |
| Time Requirement: | 2-3 class periods |
| Prerequisites: | Algebra |
| Relevant Disciplines: | Biology, Physics, Chemistry |
[ Back to Top ]
Share your satellite-based lesson ideas with the teaching community.
Send us a full lesson plan, or simply suggest a lesson idea. If you found the idea online, please share the source as well. The lesson can be about anything that helps connect learners with satellite-based technology - any grade level K-12 - any STEM subject area or geography.
"Satellite-technology" includes any part of the science, math, engineering, or technology of satellites, rockets, and remote sensing instruments as well as the use of any environmental satellite data to explore questions related to aspects of global change and local impacts in the long term, short term, and catastrophic time frames. Of special interest are lessons providing opportunities for learners to inquire, experiment, and apply mathematics.
Perhaps you designed a lesson yourself - we will happily prepare it for future publication in More Lessons from the Sky and inclusion in the SEA Lesson Plan Library. Perhaps you found a worthy lesson plan published elsewhere - we can research it inclusion in a lesson plan spotlight. In either case, you will receive full credit for developing and/or bringing the lesson to the attention of the teaching community. Don't forget to share your insights if you tried the lesson with students.
Please share your ideas at SEA.Lessons@SatEd.org.
[ Back to Top ]
![]()

This edition of the SEA Newsletter was produced in HTML5.
It is best viewed with most recent updates of Firefox, Edge, Chrome, Opera, or Safari.
©Satellite Educators Association, Inc. https://SatEd.org SEA.Newsletter@SatEd.org
Satellite Educators Association, Inc. is a 501(c)(3) non-profit educational organization.
The SEA Newsletter is published on-line monthly except January and August and available at no cost.
SEA terms, conditions, policies, and contact information are detailed HERE.
Unless otherwise listed, all photo and image credits are the authors of the articles.
Any opinons expressed in this Newsletter are those of the authors
and not necessarily those of the Satellite Educators Association, Inc.
or any of its officers, members, or representatives.
Many SEA Newsletter items contain third-party links to sites not governed by Satellite
Educators Association, Inc. The viewer is cautioned to be aware of the terms of use and
privacy policies for those third-party sites.
![]()