
OUR VISION
The world's finest educators supporting science, technology, engineering, and math (STEM) learning for pre-kindergarten to post-graduate students using real-world applications from satellites and satellite data.
OUR MISSION
To enhance the education environment to excite students about science, technology, engineering, and math through space-based technology -- satellites and satellite data.
How Many
Satellites will
Fit in Earth Orbit?

Bob Marley

We learned about honesty and integrity - that the truth matters... that you don't take shortcuts or play by your own set of rules... and success doesn't count unless you earn it fair and square.
Michelle Obama

TABLE OF CONTENTS
Click a RED link to view article
In This Issue
Association News
John's Journey
Satellites with Ed
ACCESS
ANALYZE
APPLY
In the News
For Teachers
More Lessons
from the Sky

March 1, 2023
The Satellite Educators Association Web site, SatEd.org, features a section called Using Satellites in Education. It offers explanations and resource links following four major steps in accomplishment of the SEA Mission:
John Moore, Executive Director of the Institute for Earth Observations at Palmyra Cove in New Jersey, simplified and enhanced these four steps with just three words that have become the hallmark of the Institute's A3Sat Program:
Following that simplified approach, articles in this Spring issue of SEA Newsletter, are offered in three sections.
In Access, read about upgrades to NOAA's Mauna Loa atmospheric research facility following a near miss volcanic eruption. NOAA's updated publication of 173 global temperature maps from 1850 to date and NASA's posting of many of its sites in Spanish as well as English are both examples of expanding access to data. There are also a discussion of a NASA-built sensor tasked to monitor tropical cyclones.
The Analyze section offers stories of how the U.S. Southwest received so much early winter rain in a La Niña year and the impacts on the stratosphere of towering wildfire clouds.
The third section, Apply, speaks of how the data are used to illuminate climate change areas of interest. NOAA offers an article about atmospheric rivers - what they are and how they are studied, and NASA offers an update on its Spinoffs - the application of NASA-developed technology to bolster climate resilience and improve medical care.
Of course, don't miss Association News items and the regular features from SEA columnists. Items of interest In the News and the highlighted K-12 lesson plan from the SEA Lesson Library round out this quarterly issue of the SEA Newsletter.
Enjoy!
--Editor

[ Back to Top ]

The SEA Newsletter began quarterly publication (four times per year) with this issue. The newsletter will be posted for reading in March, June, September, and December. This is a change from the almost-monthly publication (each month except January and August) enjoyed since 2007. The SEA Newsletter is a major communication arm of the Satellite Educators Association bringing education and aerospace news to SEA members and interested individuals. It features several regular expert columnists as well as a review of relevant items from NASA, NOAA, the aerospace industry, and the education community. And, don't forget the spotlights on the annually updated K-12 lesson modules available in the SEA Lesson Library.
The SEA Newsletter has its roots in a printed-and-mailed version called InfoSEA published by Nancy McIntyre's Educational Center for Earth Observations at West Chester University, Pennsylvania, starting in the mid-1990s to coordinate the annual Satellites & Education Conferences held at that location. With the closing of Nancy's office in 2001, InfoSEA and the fledgling SEA Web site ended. SEA moved the Satellites & Education Conference to California State University, Los Angeles and initiated the M.Y. S.P.A.C.E. Program in 2002. (See SEA History.)
Vic Everett stepped up as SEA's new Web Administrator and inaugurated the SatEd.org Web site in 2004. The new, online version of the SEA Newsletter was created several years later. On Vic's passing in 2015, Pete Arvedson offered temporary help to keep the Newsletter afloat until a new editor was found. It is now time for Arvedson to step back siting reasons of health; the December 2023 quarterly issue will be his last as editor.
The Newsletter Editor's most important role is gathering and arranging items for inclusion in each issue. The publication of the newsletter will still be handled by the SEA Web Manager once items and layout are received from the Editor. Working with the SEA Newsletter Committee is enjoyable and helps keep one in touch with what's happening. There is always room for qualified, interested, people who want to help. The more contributors there are, the easier the job of the editor.
Anyone who would like the pleasure of helping - a little or a lot - please contact the SEA Executive Committee at SEA.Newsletter@SatEd.org. Any suggestions for changes you would like to see in the SEA Newsletter, contact us at the same address.
[ Back to Top ]
In February 1964, an album from songwriter-musician Bob Dylan featured the song The Times They Are A-Changin'. It is mentioned here as a reminder that things continue to change and evolve as we move through life and time. For 35 years, every year from 1988 to 2022, the Satellite Educators Association (SEA) produced and hosted an annual Satellites & Education Conference. It was always an extraordinary, multi-day event with phenomenal speakers, exciting exhibitors, and a presence from NOAA, NASA, and aerospace industry that was remarkably supportive of classroom teachers and their students. Every year, that is, until now. This year, 2023, will be the first in three and a half decades without a Satellites & Education Conference. With retirements and venue changes, it became apparent that SEA could not produce a stand-alone conference this year.
A new conference called SmallSat Education Conference was held for the first time in October at Kennedy Space Center in Florida. It is billed as a "gathering where educators, administrators, and students will learn about CubeSats, ThinSats, and High Altitude Balloon programs." The "target audiences are faculty and students from middle school through college." The event includes a strong student presence reminiscent of the M.Y. S.P.A.C.E. Program. Planning is currently underway for the second conference in October 2023. Members of the SEA Executive Committee are already participating actively with the planning committee.
Stay tuned for more information as it becomes available. Better yet, don't wait - check out Welcome to SmallSat Education Conference 2023 now.
[ Back to Top ]
Satellites & Education Conference VI was held in March 2003 at West Chester University, Pennsylvania. Helen Martin was President of SEA; John Tillery, Vice President; and Nancy McIntyre, Conference Coordinator. NOAA had a very strong supportive presence at the conference. Attending teachers were enticed by direct read-out systems on display from various companies selling for about $3000 - a massive sum for most teachers at the time.
Satellites & Education Conference XVI was held in March at California State University, Los Angeles in California. Paula Arvedson was President of SEA and, as a professor in Cal State LA's Charter College of Education, also Conference Coordinator. The M.Y. S.P.A.C.E. Program was in its second year presenting a final research report "Using GIS to Analyze Local Climatic Events."
Satellites & Education Conference XXVI was held in August 2013 at Cal State LA. Mark McKay was President of SEA; Dean Davis, Vice President; Paula Arvedson, Conference Coordinator. This is the tenth year of operation for the new SatEd.org Web site and monthly, online SEA Newsletter has been available for most of that same time period. The M.Y. S.P.A.C.E. Program was in full swing with student groups from schools in Califonria; New Jersey; Xiamen, China; and Canterbury, United Kingdom. The M.Y. S.P.A.C.E. Team's final report of research was "Environmental Impacts of Particulate Aerosols."
See more dates of coming rocket launches and sky-watching events at https://www.space.com/32286-space-calendar.html
[ Back to Top ]


By John D. Moore, Executive Director, Institute for Earth Observations at Palmyra Cove, New Jersey
Welcome to 2023! My Journey has been long, but it is not over yet. As you will read this month, there is an ever-present and rapid expansion of satellites, space technologies, and STEM. As I get more involved with new communities and experience their excitement and energy, I am quick to remember the Satellite Education pioneers from decades past who worked diligently through new challenges in hardware, software, and educational products. As you might imagine, I read numerous articles and research on CubeSats and found a new and interesting term, "The New Space Ecosystem." It is my observation that the entire space enterprise is entering into what I refer to as "Chapter 2." It reminds me of decades ago when the space program and NASA first began. It was all new, exciting and challenging. It pushed the USA into a period of excellence that was unprecedented -- that is until now. Mars, the Moon, new space stations, new rockets, space industries and tourism, it is much like the 1960’s. As space technologies expand and other countries move into space, thinking about national and global security comes to the fore. I have long held that STEM education must be a primary concern in that thinking. Now is not the time to relax educational standards or expectations. It is the time to promote excellence, celebrate personal achievements and intellectual merit, and capitalize on our nation’s most precious resource -- innovation! Join me as my Journey continues.
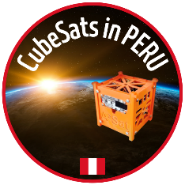
The purpose of this program is to provide K-12 students, educators and their communities the opportunity to experience interactive STEM and space science content reflective of International science through a unique collaboration of community and nontraditional partners that include both social and professional organizations. Currently, there are sixteen schools in Peru, two in Colorado, and three A3Sats going to Brazil for their Science Days events. As part of the project there has been eight webinars held throughout February sponsored by "One Voice." We are very excited because there has been an average of about 90 participants attending each Zoom event. As we move forward into March, we all look forward with great anticipation of student success stories, and how A3Sat spurred interest in space, and their futures.


https://www.youtube.com/watch?v=33-ZyXC8pAM&t=4s
A few months ago, I was introduced to Jefferson Michaelis of the "Michaelis Foundation" in Brazil. We are looking towards the future of welcoming Brazil into the A3Sat "family." For some background, the first Science Days event was held last year. By all accounts, it was a huge success. While it focuses on the many aspects of STEM, it hosts a strong space and space technology presence. The purpose of Science Days (SD) is to "excite the world's youth about Space Exploration and STEAM endeavors. Science Days provides students, educators and their families the opportunity to explore the world of science, and in particular space exploration, for free at our global events. Understanding Space is one of the best ways to help those of all ages appreciate science and the role it plays in our lives and in understanding our universe." As I always say, "You can teach anything with satellites!" In Brazil, Science Days are held on school and university campuses and is administered by the Michaelis Foundation Board of Directors, and the University Council. Sound familiar? Recall that one of SEA’s premier programs over the years was M.Y. S.P.A.C.E. Similarly, we welcomed teachers and students from many nations to work together on common issues that confront our planet while perfecting their research and presentation skills.

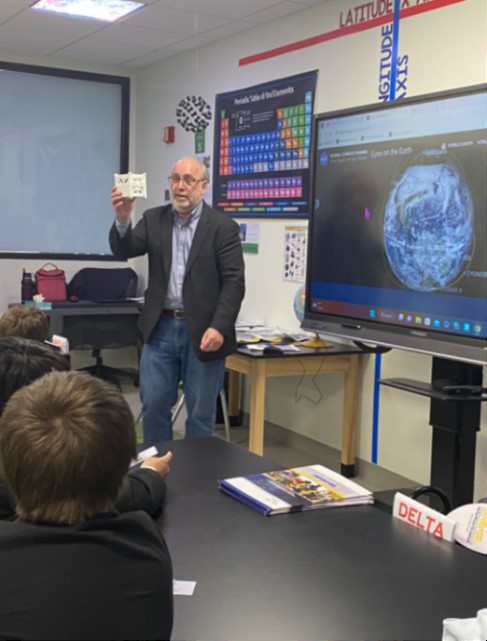
I had the honor of presenting to JB-MDL’s STARBASE. This is a group of outstanding 5th graders from neighboring schools that participate in a 5-week STEM program. All of the students I met here had great questions, inquisitive minds...and energy! While my main focus was in sharing the many Earth Observing Satellites providing environmental data and imagery, I did take the opportunity to introduce them to CubeSats, and the A3Sat Project. They are ready to engage! According to NSF research, many students are making career decision at this early age, especially young women. The Department of Defense’s national STARBASE mission is "to expose our nation’s youth to the technological environments and positive civilian and military role models found on Active, Guard, and Reserve military bases and installations, nurture a winning network of collaborators, and build mutual loyalty within our communities, by providing 25 hours of exemplary hands-on instruction and activities that meet or exceed the National Standards." It is certainly happening here, and I am proud to be a small part of it.
"A3Sat: Using CubeSats to Inspire the Next Generation of Earth SySTEM Professionals" was awarded a $10,000.00 grant from the New Jersey Space Grant Consortium (NJSGC) with another matching grant provided by the Palmyra Cove Environmental Education Foundation. The project will begin this Spring. The main goal is to "develop a Pre-College SmallSat Earth SySTEM Community supported by the NASA Space Grant Consortium, NASA’s GLOBE Program, and NASA’s GLOBE Mission Earth preparing students for careers in the NEW SPACE ECOSYSTEM."
While there may be hundreds, if not thousands, of pre-college education programs around the world designing CubeSats with a goal of launching into space, there is limited access to space, and the costs of building a "space-ready" CubeSat prohibits the majority of schools from participating. That does not lessen the value and need of broadening participation through developing skills sets that will be necessary in the New Space Ecosystem.
The A3Sat Emulator was designed to authentically replicate building a "Tier1" CubeSat for pre-college students at a price point affordable to most pre-college institutions or clubs. Work on V2.0 moves towards a"Tier2" Emulator, i.e. a more "space-ready emulator." This is currently being used at the US Naval Academy as part of their labs.
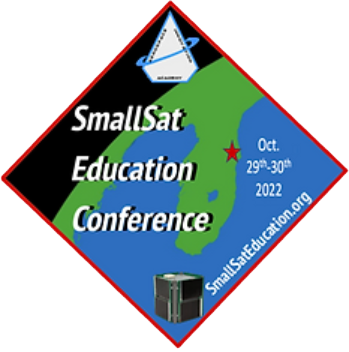
The SmallSat Education Conference "serves as an important East Coast gathering where educators, administrators, and students will learn about CubeSats, ThinSats, and High-Altitude Balloon programs." The target audiences are faculty and students from middle school through college.
For the latest information on the 2023 conference to be held at NASA’s Kennedy Space Center (KSC) in Florida, go to: https://www.smallsateducation.org/.
Representatives from SEA are already helping with the planning of the 2023 conference. And there is always room for more input. If you have an interest in serving on one of this year’s Planning Committees, please email Kevin Simmons at ksimmons@bluecubesat.com.
Remember - "you can teach anything with satellites."
Stay safe - stay well!
For now, I'm John...and this is my Journey
[ Back to Top ]

By Edward Murashie, President, ProEngineered Solutions
On Friday, February 17, 2023, Ed Murashie worked with a group of 5th graders for DoD STARBASE at Vandenberg Space Force Base in California. The topic was latitude and longitude. His chosen vehicle of interest to teach this topic was the International Space Station and its on-board Sally Ride EarthKam which can be controlled from the Earth's surface. In lieu of the usual Satellites with Ed, here are excerpts from Ed's e-mailed report of the activity, shared with permission.
Thanks, Ed.
This was the second time I presented to the DOD STARBASE student's at Vandenberg SFB, and this time it was about the International Space Station. It did not go as expected but the students learned the old saying "chance favors the prepared," but not always, and we had a good laugh.
They learned about latitude, longitude, the ISS, and we met our goal of each student picking a location on the ISS track to command the on board camera to take a picture. This was all done despite having spotty Internet reception from the teacher's phone hotspot and the power going out half-hour into my presentation and staying out for the rest of the day! Good thing for the good old chalkboard and props I took. I used volunteer students to explain how you can see the ISS with light and shadows just like the moon phases. They learned about orbits, latitude, and longitude, all terms used in the ISS image planning. Finally using the notebook computers I took and the teacher's hotspot, several volunteers and I sat down at each of the eight tables for a total of 60 students and let the students pick their ISS image location.
Even though we commanded 60 images, only 35 nice photos posted on the EarthKAM website from our mission. You can go to EarthKAM.org, click on IMAGES, then select Visit the Gallery, type roserazo-smoc in the box that says Search the Gallery, then press the ENTER key. The second image is one of the best images.
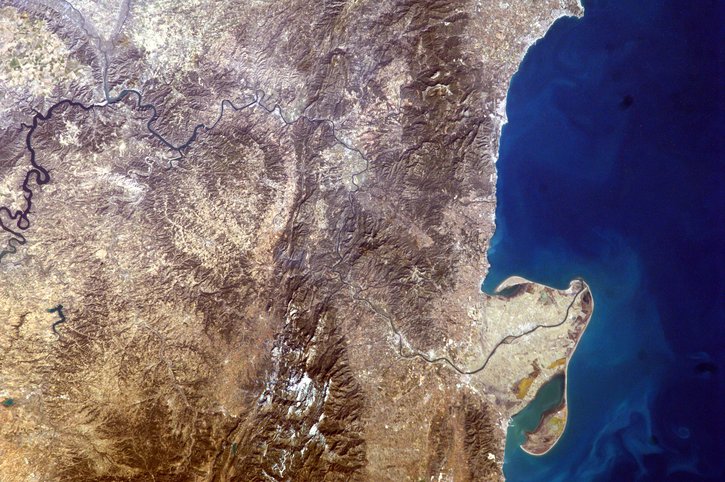
I found the NASA coordinates posted for each photo to be slightly off, so it can be a geographic challenge to find the exact location. For example, the image above (http://images.earthkam.org/main.php?g2_itemId=2057362) is not in the middle of Spain as indicated by the NASA-given coordinates but on the coast. A general internet search for other images produced an Earth Observatory image of Ebro River Delta, about 200 km (120 miles) southwest of Barcelona, Spain (https://earthobservatory.nasa.gov/images/91832/the-sculpting-of-ebro-delta) which clearly identifies the EarthKam image location. Coincidentally, this same image from Earth Observatory was one selected for publication in the student's take home paper.
Hopefully the lesson inspired the students. One great question especially from a 5th grader was "where is a good technical college?" I told them about the CubeSat program at Cal Poly San Luis Obispo. Despite the rough start, the teacher was happy and I was invited back any time. I hope to make this trip once a quarter.
Find more about DoD STARBASE, a Department of Defense Youth Program, at https://dodstarbase.org/ and how to access the Sally Ride EarthKam on the International Space Station at https://www.earthkam.org/.
[ Back to Top ]


From NOAA's News & Features at https://www.noaa.gov/news/having-dodged-lava-flows-noaas-mauna-loa-research-facility-to-get-upgrades
February 6, 2023
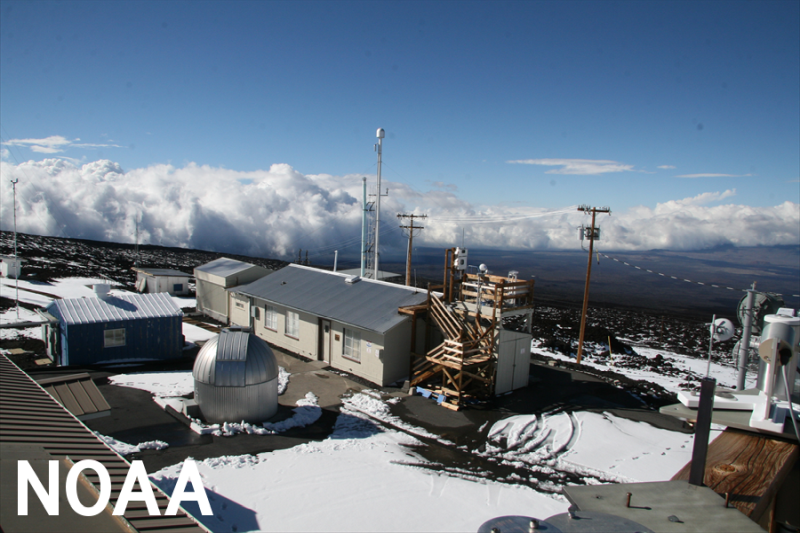
NOAA’s Mauna Loa Atmospheric Baseline Observatory, the benchmark sampling site for monitoring global climate change, is slated to undergo a major renovation and facility upgrade once road access is restored over lava flows produced by the recent eruption of Mauna Loa volcano, NOAA announced today.
The redevelopment project will modernize the site's aging infrastructure and renovate the historic Keeling building. Plans call for increased solar generation and installation of a battery power backup system to make the observatory more energy efficient and more resilient to future natural disasters. The project will increase the observatory’s scientific capabilities and create new opportunities for research collaboration.
"Mauna Loa is a premier international research facility," said Ariel Stein, acting director of NOAA’s Global Monitoring Laboratory. "This project will honor our history as we upgrade our scientific facilities, make them energy-efficient and generate power on-site to reduce the risk of disruption. This will provide a more productive and effective research campus for NOAA and our scientific partners for decades to come."
[ Back to Top ]
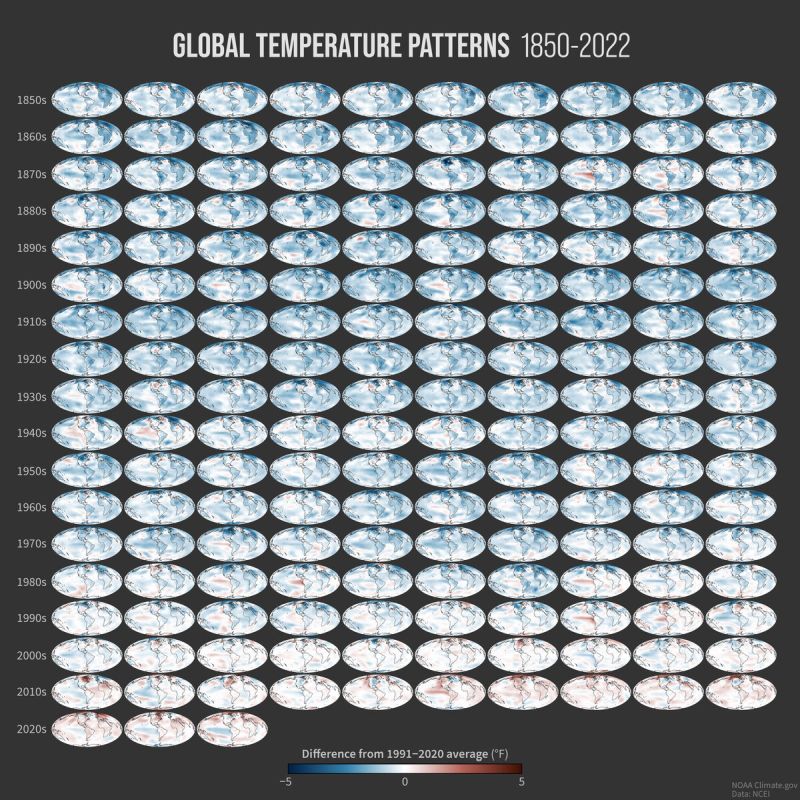
From Climate.gov https://www.climate.gov/news-features/features/look-all-173-noaas-new-global-temperature-maps
By Rebecca Lindsey
February 17, 2023
Last week, NOAA National Centers for Environmental Information released a major update to the agency’s global surface temperature dataset. The new product tracks temperatures back to 1850, adding 30 additional years to the historical record, and it has complete geographic coverage over data-sparse areas at the poles.
In honor of the new release, Climate.gov has made a poster-size image showing global temperature patterns for every year in the new data set. Each year’s annual average temperature is compared to the 1991-2020 average, which makes it clear how long-term global warming has affected Earth’s temperature. The farther back in time you look, the colder the temperatures were (darker blues over larger areas) compared today.
Scattered among the blue globes in early decades are years with a wash of red across the eastern tropical Pacific, likely linked to El Niño, the warm phase of the El Niño-Southern Oscillation climate pattern. At the other end of the record, the pattern reverses, with the colder-than-average waters of La Niña standing out on maps that are otherwise dominated by warmer-than-average conditions. Now here's a question for other map geeks: what would the series look like if we had compared each year to the 1851-1880 average? To the 20th-century average?
From NASA News at https://www.nasa.gov/press-release/nasa-launches-aeronautics-spanish-language-webpages
January 27, 2023
As part of its effort to provide more resources and information to new audiences, NASA has launched new webpages featuring aeronautics information in Spanish. The webpages aim to make aeronautics content more accessible to the Spanish-language community.
"This is a significant step forward in our efforts to make the knowledge we've accumulated at NASA available to people all over the country, and the world. We're making sure that as we explore and tackle the biggest challenges facing aviation, we're providing benefits for all," said Bob Pearce, associate administrator for NASA"s Aeronautics Research Mission Directorate. "By presenting aeronautics information and educational materials in Spanish, we"re working to foster a diverse, bold and effective next generation of explorers. We"re counting on this generation to help NASA carry its vision into the future."
[ Back to Top ]
From NASA Jet Propulsion Laboratory at https://www.jpl.nasa.gov/news/dynamic-nasa-built-weather-sensors-enlisted-to-track-tropical-cyclones
February 23, 2023
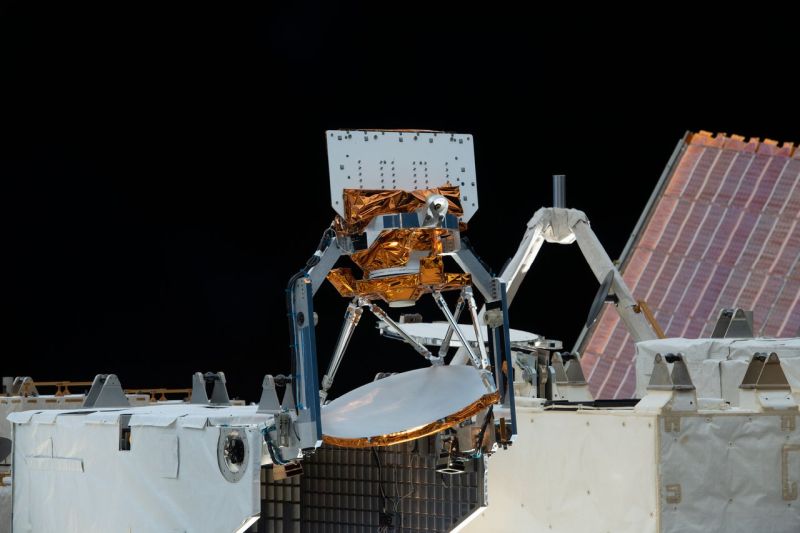
Known as COWVR and TEMPEST, the duo is demonstrating that smaller, less expensive science instruments can play an important role in weather forecasting.
NASA recently built two weather instruments to test the potential of small, low-cost sensors to do some of the work of bulkier, pricier satellites. Both instruments have exceeded expectations as trial runs, and they are already delivering useful forecast information for the most devastating of storms, tropical cyclones...
[ Back to Top ]


By Nat Johnson from Climate.gov at https://www.climate.gov/news-features/blogs/did-la-ni%C3%B1a-drench-southwest-united-states-early-winter-202223
February 23, 2023
Another meteorological winter is drawing to a close, though it feels like some of us in the East are still waiting for winter to arrive (not a single inch of snow here in central New Jersey so far!). I realize that this winter has been more eventful in other parts of the country, notably in the western U.S., where torrential rains and heavy mountain snows occurred in December and January. Such heavy precipitation was unexpected prior to the season in a region afflicted with a multi-year severe drought, especially given that we are in the third consecutive winter of La Niña. How unusual were these Southwestern wet conditions in the first two-thirds of a La Niña winter? And did tropical sea surface temperatures contribute? In this blog post, I hope to get this conversation rolling!
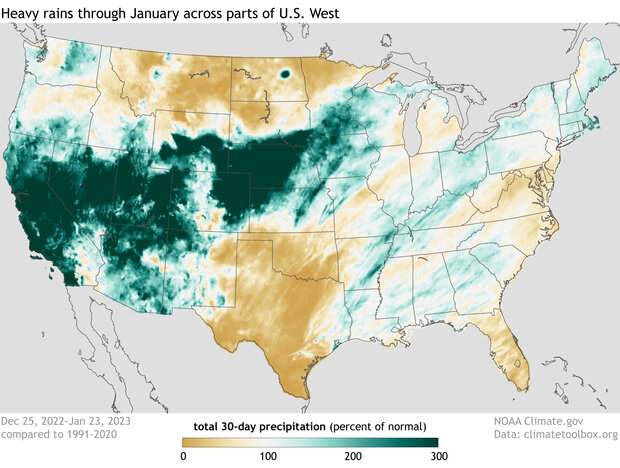
As the figure above shows, much of the western U.S. was pummeled from late December through mid-January, as a series of nine atmospheric rivers dumped more than a season’s worth of rain and snow in a few short weeks. The relief from an unrelenting drought was welcome, but too much of a good thing also meant flooding, mudslides, and dangerous debris flows.
More information about the El Niño - Southern Oscillation (ENSO) can be found at https://www.climate.gov/enso.
[ Back to Top ]
From NOAA Research News at https://research.noaa.gov/article/ArtMID/587/ArticleID/2942/Towering-wildfire-clouds-have-big-impacts-on-the-stratosphere
February 23, 2023
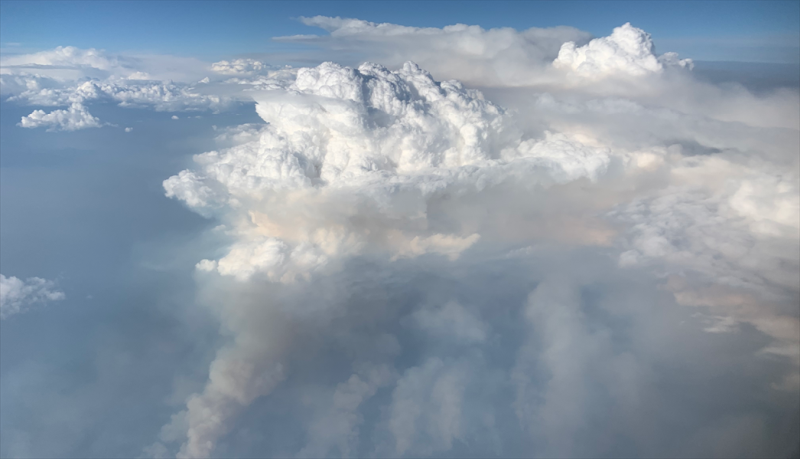
Images of vast clouds of wildfire smoke towering into the sky have become all too familiar from recent active fire years across the western United States and Australia. Now, a team of atmospheric scientists led by NOAA has demonstrated these big vertical plumes of wildfire smoke have a major long term impact on the stratosphere - and climate.
Fire-triggered thunderstorms, called pyrocumulonimbus or pyroCbs, are generated when the intense heat of a wildfire triggers a huge thunderstorm that carries smoke into the stratosphere, five to seven miles above the surface. In 2017, the flight path of a NASA airborne mission to study the background atmosphere over the remote oceans, the Atmospheric Tomography mission (ATom), intersected with smoke from the largest pyroCb event observed in the satellite era to that date over the Pacific Northwest. The smoke injection was so large that remote sensing instruments around the globe monitored it for more than eight months. Measurements showed that it and several additional Northern Hemisphere pyroCb events that year dominated contributions of black carbon and organic carbon to the lower stratosphere, the net effect of which cooled the planet.
The results have been published in the journal Science.
[ Back to Top ]


From NOAA Research News at https://research.noaa.gov/article/ArtMID/587/ArticleID/2926/Atmospheric-Rivers-What-are-they-and-how-does-NOAA-study-them
January 11, 2023
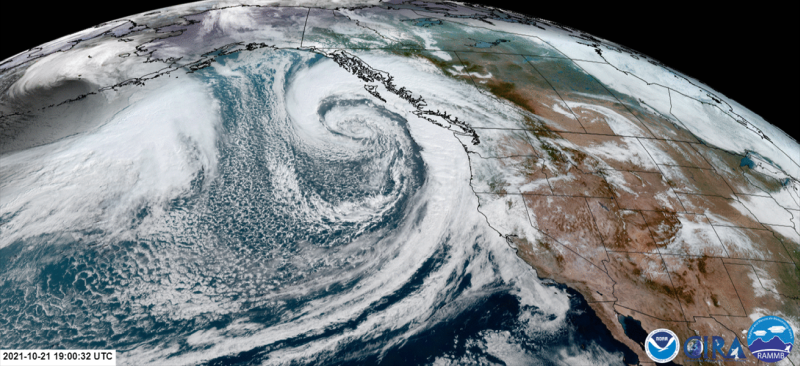
NYou may have heard of atmospheric rivers in the news lately due to the intense rainfall and flooding along the U.S. West Coast. These naturally occurring air currents can bring both severe disruption and great benefit through the heavy rain and mountain snows that contribute to regional water supply. On average, about 30 to 50 percent of annual precipitation in the west coast states occurs in just a few atmospheric river events. NOAA studies atmospheric rivers to improve forecasting capabilities as well as to improve our understanding of atmospheric river impacts on communities and the physical environment.
Atmospheric rivers are long, concentrated regions in the atmosphere that transport moist air from the tropics to higher latitudes. The moist air, combined with high wind speeds, produce heavy rain and snow upon landfall, especially over mountainous terrain. These extreme precipitation events can lead to flash flooding, mudslides, and catastrophic damage to life and property. When atmospheric rivers pass over land they can cause conditions similar to those of hurricanes with intense and rapid rainfall, cyclone force winds, and significantly increased wave heights. In October 2021, an atmospheric river event hit California, severely impacting the San Francisco Bay area. After rapidly intensifying, the low pressure system produced record rainfall, up to 80 mile per hour winds, and up to 60 foot waves. These conditions are similar to those currently occurring along the west coast, with some areas in California already seeing over 18 inches of rain within the past week. Nearly all of California has seen significantly above average rainfall with totals 400-600% above average values.
[ Back to Top ]
From NASA News - Benefits to You at https://www.nasa.gov/press-release/nasa-spinoffs-bolster-climate-resilience-improve-medical-care-more
January 31, 2023
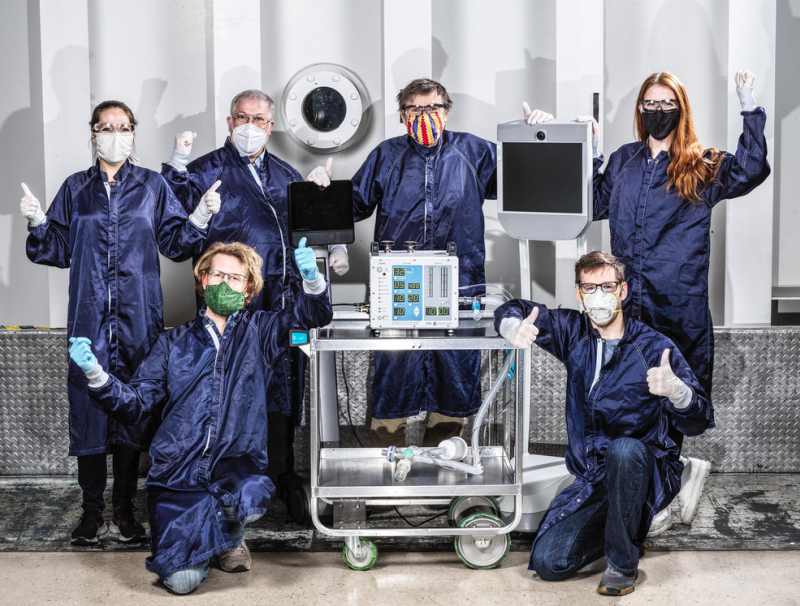
When it comes to NASA, most people look to the skies as rockets, rovers, and astronauts push the boundaries of space exploration. But the benefits of going above and beyond can be found here on Earth through products and services born from NASA innovation.
The latest edition of NASA’s Spinoff publication features dozens of new commercialized technologies that use the agency’s technology, research, and/or expertise to benefit people around the globe. It also includes a section highlighting technologies of tomorrow.
"From the heavens to hospitals around the world, NASA spinoffs are improving life for all of humanity," said NASA Administrator Bill Nelson. "The work NASA does in research and technology gives businesses a competitive edge, driving an economy that allows America to compete globally and creating good-paying jobs for this generation – and the next."
NASA's Spinoff 2023 features more than 40 companies using NASA technology, research, and funding to create better batteries to store green energy, improve airport ground traffic to save passengers and airlines time while cutting fuel costs, distribute ventilators around the world, and even heal wounds faster on humans and animals alike.
[ Back to Top ]


From NASA Jet Propulsion Laboratory at https://www.jpl.nasa.gov/news/nasas-perseverance-rover-shows-off-collection-of-mars-samples
February 14, 2023
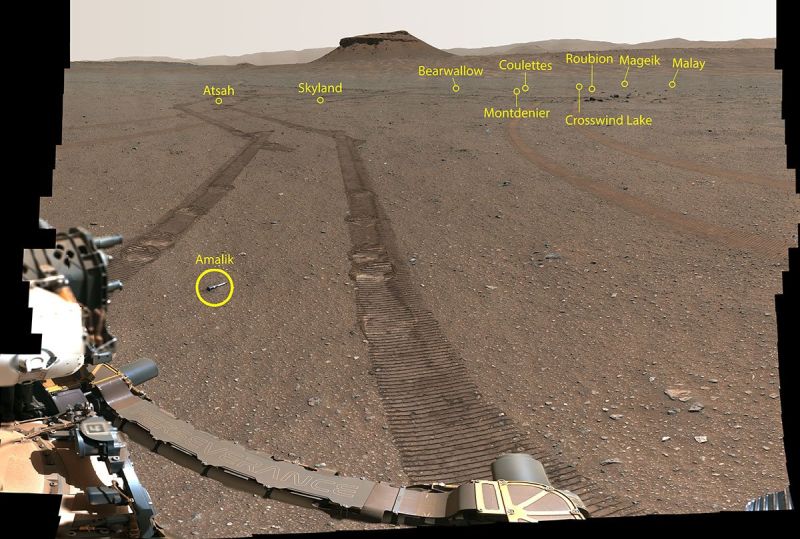
The Red Planet rover snapped a portrait of the sample depot it has assembled with 10 backup sample tubes that could be returned to Earth by a future mission.
Even space robots know what "pics or it didn't happen" means: NASA's Perseverance Mars rover provided a panorama of its recently completed sample depot – a big milestone for the mission and humanity's first collection of samples on another planet. The panorama, stitched together from 368 images that were sent to Earth, captures more than a month of careful placement and mapping of 10 titanium tubes.
Eight of those tubes are filled with rock and regolith (broken rock and dust), while one is an atmospheric sample and one is a "witness" tube. The rover photographed the depot using the Mastcam-Z camera on the top of its mast, or "head," on Jan. 31, 2023. The color has been adjusted to show the Martian surface approximately as it would look to the human eye.
The depot represents a backup collection of samples that could be recovered in the future by the Mars Sample Return campaign, a joint effort between NASA and ESA (European Space Agency) that aims to bring Mars samples to Earth for closer study. The rover began building the depot on Dec. 21, 2022, precisely spacing the tubes in case they need to be retrieved at a future date.
[ Back to Top ]
From USGS News at https://www.usgs.gov/news/featured-story/m78-and-m75-kahramanmaras-earthquake-sequence-near-nurdagi-turkey-turkiye
November 28, 2022
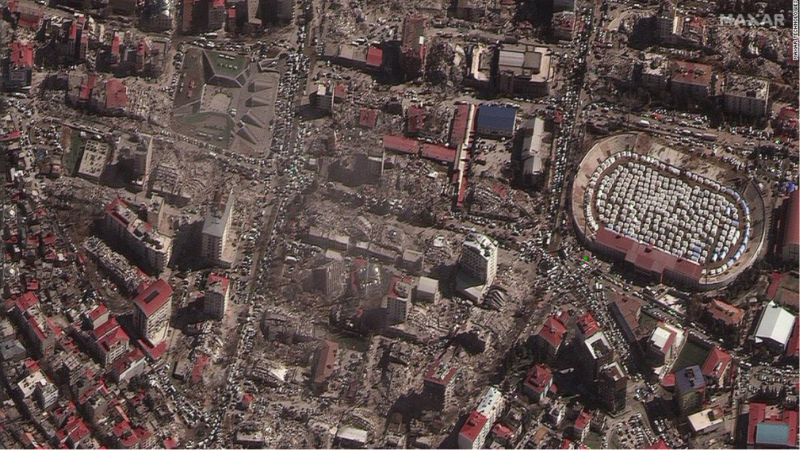
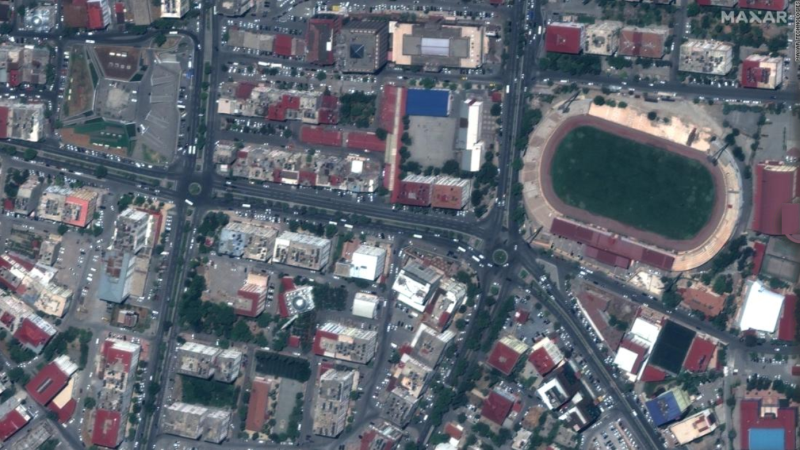
On February 6, around 4:15 a.m. local time, a magnitude 7.8 earthquake struck south-central Turkey (Türkiye) near the Turkey/Syria border. Just 11 minutes later, it was followed by a magnitude 6.7 aftershock. The largest aftershock at the time of writing was a M7.5 aftershock which struck 95 km (~60 miles) to the north. USGS observations and analyses indicate all these events are occurring within the East Anatolian fault system.
Though an earthquake of this magnitude is rare anywhere in the world, this type of event is generally expected on long, plate-boundary strike-slip faults.
"It's difficult to watch this tragedy unfold, especially since we've known for a long time that the buildings in the region were not designed to withstand earthquakes," said USGS scientist David Wald. "An earthquake this size has the potential to be damaging anywhere in the world, but many structures in this region are particularly vulnerable."
The two largest earthquakes in the recent series are relatively shallow, with the mainshock 18 kilometers, or 11 miles, deep and the 7.5 magnitude aftershock at 10 kilometers (just over 6 miles) deep. Because the quakes are relatively shallow, the intensity of the shaking is severe.
[ Back to Top ]
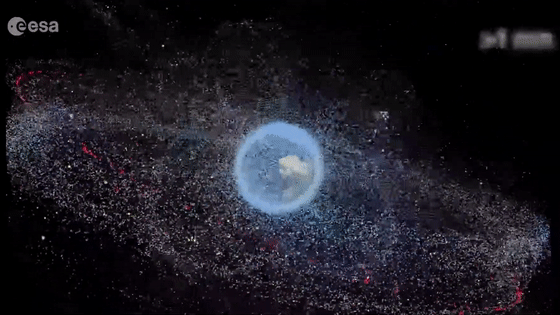
From Space.com at https://www.space.com/how-many-satellites-fit-safely-earth-orbit
By Tereza Pultarova
February 27, 2023
Just 10 years ago, a mere thousand or so operational satellites may have orbited our planet, but there will be tens or even hundreds of thousands a decade from now.
Experts have been sounding alarm bells for years that Earth orbit is getting a bit too crowded. So how many satellites can we actually launch to space before it gets to be too much?
Jonathan McDowell is an astrophysicist and astronomer at the Harvard-Smithsonian Center for Astrophysics who studies super-energetic phenomena in the universe such as jet-emitting black holes in galactic centers. In recent years, however, McDowell has gained prominence for his work in a completely different field of space research. In his monthly digital circular called Jonathan's Space Report (opens in new tab), McDowell tracks the growing number of satellite launches and the ballooning number of objects in Earth orbit.
The project started with an ambition to "provide a pedantic historical record of the space age," but has, in a way, become a chronicle of the environmental destruction of the near Earth environment. In his frequent media appearances, McDowell has been vocal about his views on the future of the increasingly overcrowded near-Earth space.
"It's going to be like an interstate highway, at rush hour in a snowstorm with everyone driving much too fast," he told Space.com when asked what the situation in orbit will be like if existing plans for satellite megaconstellations such as SpaceX's Starlink, OneWeb and Amazon Kuiper come to fruition. "Except that there are multiple interstate highways crossing each other with no stoplights."
[ Back to Top ]


The More Lessons from the Sky Analysis Toolbox contains informative articles, descriptions of software packages, and tutorial samples for teachers to use when planning and implementing lessons utilizing satellites and satellite-based technologies including remote-sensing environmental data available online. This collection of "tools" continues to grow as new or revised items are posted periodically. Some of the tools have been referenced by specific lesson plans in the SEA Lesson Plan Library.
Check it out today! https://SatEd.org/library/Tools.htm
[ Back to Top ]

Cumbre Vieja volcanic eruption, Canary Islands - September 19, 2021; Hunga-Tonga-Hunga Ha'apai eruption, Tonga - January 15, 2022; Mauna Loa eruption, Hawaii - November 29, 2022. Just three examples of volcanoes spewing ash and dust into the atmosphere. With what effect? This case study will help students discover impacts of volcanic eruptions near and far.
On April 14, 2010, after a small volcanic eruption a month earlier, Iceland’s Mount Eyjafjallajökull exploded shooting more than 250 million cubic meters of earth into the atmosphere. Molten earth and ash were blown upwards with enough energy for them to reach an altitude of 9 kilometers (about 30,000 feet or a little more than 5.5 miles). The April eruption was categorized 4 on the Volcanic Explosivity Index. That is at least 10,000 times more materials sent 10-100 times higher than the smaller eruption on March 20. The volcano’s latitude and wind conditions may have contributed to the formation of a cloud of abrasive glass-rich ash from erupting lava cooling faster than usual.
In this activity, using images of remotely sensed satellite data, learners will detect the position of the ash plumes from the volcano’s eruptions and compare them to wind conditions. They will monitor and report the movement of the ash plumes relative to population centers and air traffic in order to tell the story of this eruption and its impact on human and other populations.
| Grade Level: | 9-12 |
| Time Requirement: | 2 class periods |
| Prerequisites: | None |
| Relevant Disciplines: | Biology, Chemistry, Earth Science, Geography |
[ Back to Top ]
Share your satellite-based lesson ideas with the teaching community.
Send us a full lesson plan, or simply suggest a lesson idea. If you found the idea online, please share the source as well. The lesson can be about anything that helps connect learners with satellite-based technology - any grade level K-12 - any STEM subject area or geography.
"Satellite-technology" includes any part of the science, math, engineering, or technology of satellites, rockets, and remote sensing instruments as well as the use of any environmental satellite data to explore questions related to aspects of global change and local impacts in the long term, short term, and catastrophic time frames. Of special interest are lessons providing opportunities for learners to inquire, experiment, and apply mathematics.
Perhaps you designed a lesson yourself - we will happily prepare it for future publication in More Lessons from the Sky and inclusion in the SEA Lesson Plan Library. Perhaps you found a worthy lesson plan published elsewhere - we can research it inclusion in a lesson plan spotlight. In either case, you will receive full credit for developing and/or bringing the lesson to the attention of the teaching community. Don't forget to share your insights if you tried the lesson with students.
Please share your ideas at SEA.Lessons@SatEd.org.
[ Back to Top ]

![]()

This edition of the SEA Newsletter was produced in HTML5.
It is best viewed with most recent updates of Firefox, Edge, Chrome, Opera, or Safari.
©Satellite Educators Association, Inc. https://SatEd.org SEA.Newsletter@SatEd.org
Satellite Educators Association, Inc. is a 501(c)(3) non-profit educational organization.
In 2023, the SEA Newsletter changed from monthly to quarterly publication (March, June, September, and December). The SEA Newsletter is published on-line and available at no cost.
SEA terms, conditions, policies, and contact information are detailed HERE.
Unless otherwise listed, all photo and image credits are the authors of the articles.
Any opinons expressed in this Newsletter are those of the authors
and not necessarily those of the Satellite Educators Association, Inc.
or any of its officers, members, or representatives.
Many SEA Newsletter items contain third-party links to sites not governed by Satellite
Educators Association, Inc. The viewer is cautioned to be aware of the terms of use and
privacy policies for those third-party sites.
![]()