OUR VISION
The world's finest educators supporting science, technology, engineering, and math (STEM) learning for pre-kindergarten to post-graduate students using real-world applications from satellites and satellite data.
OUR MISSION
To enhance the education environment to excite students about science, technology, engineering, and math through space-based technology -- satellites and satellite data.

James E. Rogers

The polarization of Congress; the decline of civility; and the rise of attack politics in the 1980s, the 1990s, and the early years of the new century are a blot on our political system and a disservice to the American people.
Edward Brooke

TABLE OF CONTENTS
Click a RED link to view article
In This Issue
Association News
Input from Ron
John's Journey
ACCESS
ANALYZE
APPLY
More Lessons
from the Sky

June 1, 2023
Following the A3 model, articles in this Summer issue of SEA Newsletter, are offered in three sections.
In Access, read about the discovery of tens of thousands of volcanoes and sea mounts by satellite and ship-based sonar and a brief history of a very long record of sea surface temperature measurements used to monitor El Niño events.
The Analyze section offers stories of the current Eastern Equatorial Pacific where La Niña conditions are fading and El Niño conditions are developing; a new way to visualize gravity waves from tsunamis generated by undersea earthquakes; detection of severe geomagnetic storms on the Sun that can play havoc with electromagnetic affairs on Earth.
The third section, Apply, speaks of international collaboration studying and responding to solar outbursts. Another story tells of the creation by NOAA and the National Science Foundation of a new research center to address the needs of the insurance industry related to climate. Another item illuminates the use of normalize difference vegetative index (NDVI) analysis by NASA Harvest to map agricultural products globally including those from Ukraine before and during its year-long state of war.
Of course, don't miss Association News items and the regular features from SEA columnists. Items of interest In the News and the highlighted K-12 lesson plan from the SEA Lesson Library round out this quarterly issue of the SEA Newsletter.
Enjoy!
--Editor

[ Back to Top ]

The SEA Newsletter has its roots in a printed-and-mailed version called InfoSEA published by Nancy McIntyre's Educational Center for Earth Observations at West Chester University, Pennsylvania, starting in the mid-1990s to coordinate the annual Satellites & Education Conferences held at that location. With the closing of Nancy's office in 2001, InfoSEA and the fledgling SEA Web site ended. SEA moved the Satellites & Education Conference to California State University, Los Angeles and initiated the M.Y. S.P.A.C.E. Program in 2002. (See SEA History.)
Vic Everett stepped up as SEA's new Web Administrator and inaugurated the SatEd.org Web site in 2004. The new, online version of the SEA Newsletter was created several years later. On Vic's passing in 2015, Pete Arvedson offered temporary help to keep the Newsletter afloat until a new editor was found. It is now time for Arvedson to step back siting reasons of health; the December 2023 quarterly issue will be his last as editor.
Join the SEA Newsletter Committee Editor, Regular Columnist, Contributor, or Reviewer.
The most important role of the Newsletter Editor is gathering and arranging items for inclusion in each issue. The publication of the newsletter will still be handled by the SEA Web Manager once items and layout are received from the Editor. Working with the SEA Newsletter Committee is enjoyable and helps keep one in touch with what's happening. There is always room for qualified, interested, people who want to help. The more contributors there are, the easier the job of the editor.
Regular columnists write an item for the Newsletter each month. Their columns have a unique name and pictured by-line. Each has a different focus or emphasis which they share each month.
Contributors keep an eye out for items they think may be of interest to the readership and regularly forward those items to the editor.
Reviewers include anyone who has a constructive comment and/or suggestion about Newsletter content or format. These are forwarded to the editor who may discuss them with the entire Newsletter Committee for possible action.
Anyone who would like the pleasure of helping - a little or a lot - please contact the SEA Executive Committee at SEA.Newsletter@SatEd.org. Any suggestions for changes you would like to see in the SEA Newsletter, contact us at the same address.
[ Back to Top ]
By Pete Arvedson, SEA Web Manager
June 1, 2023
A new conference called SmallSat Education Conference was held for the first time in October at Kennedy Space Center in Florida. It is billed as a "gathering where educators, administrators, and students will learn about CubeSats, ThinSats, and High Altitude Balloon programs." The "target audiences are faculty and students from middle school through college." The event includes a strong student presence reminiscent of the M.Y. S.P.A.C.E. Program. Planning is currently underway for the second conference in October 2023. Members of the SEA Executive Committee are already participating actively with the planning committee.
In February 1964, an album from songwriter-musician Bob Dylan featured the song The Times They Are A-Changin'. It is mentioned here as a reminder that things continue to change and evolve as we move through life and time. For 35 years, every year from 1988 to 2022, the Satellite Educators Association (SEA) produced and hosted an annual Satellites & Education Conference. It was always an extraordinary, multi-day event with phenomenal speakers, exciting exhibitors, and a presence from NOAA, NASA, and aerospace industry that was remarkably supportive of classroom teachers and their students. Every year, that is, until now. This year, 2023, will be the first in three and a half decades without a Satellites & Education Conference. With retirements and venue changes, it became apparent that SEA could not produce a stand-alone conference this year.
The first Satellites & Education Conference (1988) and the foundation of the Satellite Educators Association (1989) was accomplished by teachers interested in using weather satellite direct read-out with students in the classroom. The early equipment included a home-built antenna, a short-wave radio capable of receiving frequencies just below the amateur radio 2-meter band, and a used/refurbished wet paper facsimile printer. A special, circular slide rule-like calculator produced by NOAA was used to predict the location and timing of an overhead pass by a NOAA polar-orbiting weather satellite using updated orbital elements mailed periodically from NOAA on postcard. A receiving station in Southern California, for example, could receive a real-time image of the Earth from Cabo San Lucas in Baja California to Alaska with a width from just east of the Rocky Mountains to half-way to Hawaii. Other direct read-out stations could receive real-time imagery with similar length and width relative to their geographical locations.
Those gathered at the first Satellites & Education Conference discussed how teachers with receiving stations in Washington, Southern California, Maine, Pennsylvania, Florida, and England might share such imagery to develop a broader, more global perspective with students -- a major problem since all were equipped with 2400 baud MODEMs on dedicated telephone numbers and very few, if any, classroom computers.
Within a few short years, two important developments provided the solution as well as a significant boost to interest in the Satellites & Education Conference: classroom computers and the Internet. It was a time when desktop computers were becoming more available for schools and student use. Satellite tracking, data visualization, and image analysis provided a viable answer to the standard question of, "OK. Now we have computers. What are we going to do with them?" Shortly thereafter, the availability of the World Wide Web and Internet quickly expanded during the 1990s. With continued support from NOAA, NASA, and the U.S. Navy, the Satellites & Education Conference met a need and flourished.
Today, satellite-based remote sensing data are processed and archived by NOAA, NASA, and the USGS, among others, and are freely available via the Internet. Advanced computer technology (compared to 1990) is in the hands of every person with a mobile phone, and many organizations are providing their own visualizations of data. How can the Satellite Educators Association meet the needs of students and teachers in 2023?
So, what's next? Small Sats! CubeSats, single, stacked, or in arrays; picosats; simulators, emulators, balloon-launched or rocket-launched. Small Sats make satellite engineering and technology once again accessible to middle school, high school, and college students at an affordable cost. The Satellite Educators Association supports the SmallSats Education Conference.
The SmallSat Education Conference is focused on educational opportunities and curricula for community college, high school, and middle school faculty and students. It is scheduled for October 28-29, 2023 at Kennedy Space Center in Florida. Registration is now open online Special rates available for attending students and teachers. Please visit https://www.smallsateducation.org/event-details/2023-smallsat-education-conference for more information and registration.
[ Back to Top ]


By Ron Gird, Meteorologist and former Satellite/Spaceflight and Outreach Program Manager for the National Weather Service
Hi Folks.
NOAA forecasters at the Climate Prediction Center predict a near-normal 2023 Atlantic hurricane season and near- or above-normal in the central Pacific. Meanwhile, it appears "tornado alley" may be moving from Texas and Oklahoma to Tennessee and Kentucky where residents may not be prepared. Information is detailed more in these two articles. Enjoy -Ron
By Marck Fishetti, Matthew Twomby, Daniel P. Huffman
From Scientific American
May 11, 2023
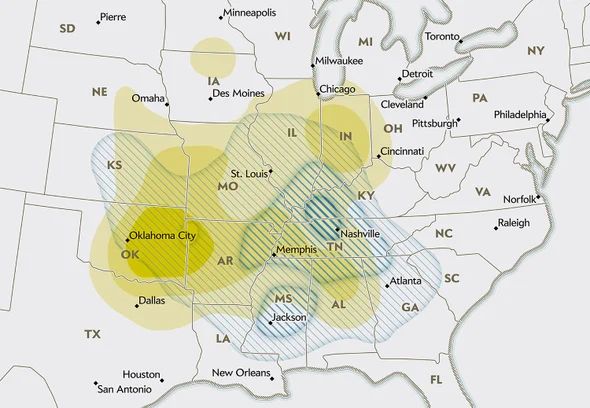
Roughly 1,200 tornadoes strike the U.S. during an average year. They’re prevalent in the U.S.—far more so than anywhere else in the world—because its geography sets up the perfect conditions, especially in spring and summer. Westerly winds from the Pacific Ocean drop their moisture when they push up over the Rocky Mountains, becoming high, dry and cool as they move farther east. Similar winds may descend from Canada. Meanwhile low, warm, humid air streams northward from the Gulf of Mexico. Flat terrain along these paths allows the winds to move relatively uninterrupted, at contrasting altitudes, until they run into one another. The angles at which they collide tend to create unstable air and wind shear, two big factors that favor tornado formation. Although somewhat similar air masses do clash in other places, such as Uruguay and Bangladesh, the forces are much more powerful over the U.S. Canada ranks second worldwide with 100 twisters a year.
El Nino, above-average Atlantic Ocean temperatures set the stage.
From NOAA News & Features at https://www.noaa.gov/news-release/2023-atlantic-hurricane-season-outlook
May 25, 2023
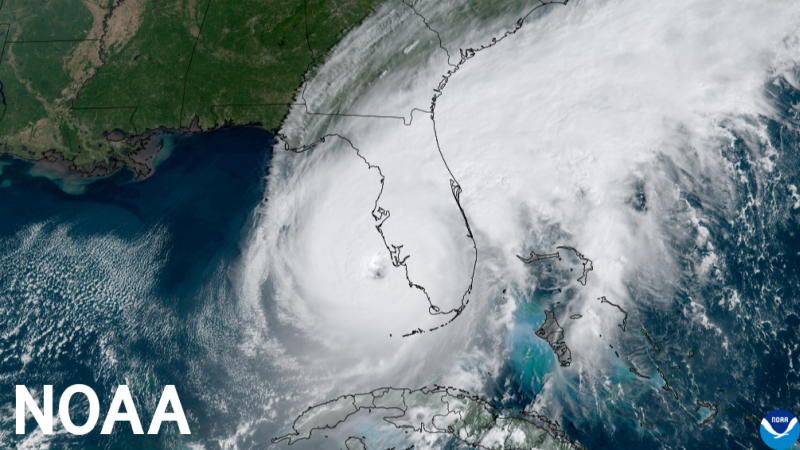
NOAA forecasters with the Climate Prediction Center, a division of the National Weather Service, predict near-normal hurricane activity in the Atlantic this year. NOAA’s outlook for the 2023 Atlantic hurricane season, which goes from June 1 to November 30, predicts a 40% chance of a near-normal season, a 30% chance of an above-normal season and a 30% chance of a below-normal season.
NOAA is forecasting a range of 12 to 17 total named storms (winds of 39 mph or higher). Of those, 5 to 9 could become hurricanes (winds of 74 mph or higher), including 1 to 4 major hurricanes (category 3, 4 or 5; with winds of 111 mph or higher). NOAA has a 70% confidence in these ranges.
[ Back to Top ]


By John D. Moore, Executive Director, Institute for Earth Observations at Palmyra Cove, New Jersey
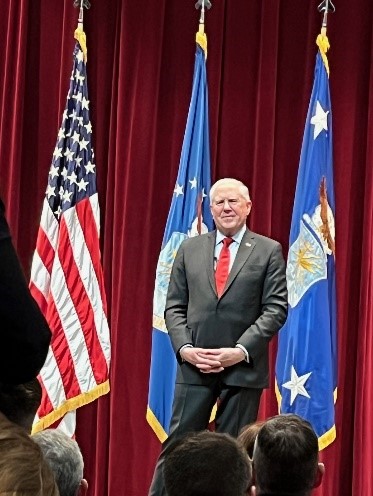
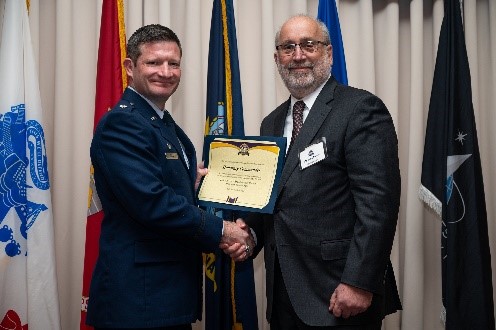
It is the unexpected opportunities that often result in journeys that take me to places that would be normally "off the beaten path." However, through my life I have become accustomed to events, that may appear at first to be unusual opportunities, coming together in a finely crafted plan. I was nominated and selected to participate in the 69th National Security Forum held at the War University at Maxwell AFB in Montgomery Alabama.
It was an extreme honor and privilege to study and work with some of the US Air Force’s highly talented and elite officers. We were briefed by the Honorable Frank Kendall III, Secretary of the Air Force, General Charles Brown Jr. Chief of Staff of the Air Force, General Chance Saltzman, Chief of Space Operations, General Kenneth Wilsbach, Commander of the Pacific Air Forces, and other high-ranking experts. I was particularly interested in General Saltzman’s remarks concerning the rapidly evolving Space Force in terms of our national defense and the evolving potential combat operations that are at the global level now. The use of space as a platform for defense, and offense, is astounding. The demand for new recruits is high. The opportunity to work with very bright people and equipment that one may never touch in the civilian/commercial world – an unparalleled experience.
In summary, we are in the midst of a transition incorporating the use of space, the creation of new technologies, and educating the next generation of our USAF in defense of America and the world. What became abundantly clear is the role of CubeSats, or more generally, small satellites. Now, more than ever, the lessons and experiences that SEA has provided over the decades plays a critical role in our national and global society.
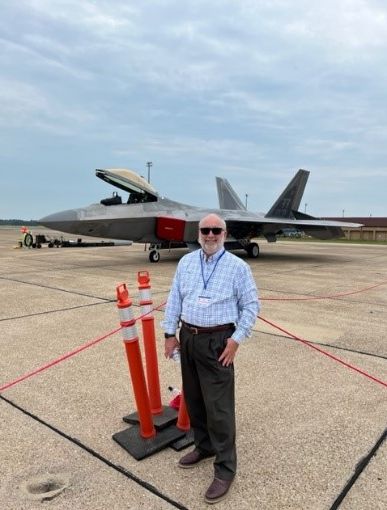
On a less serious note, but no less exciting for me, we were treated to a flying demonstration of the F-22. Anytime I'm around airplanes, I'm happy.

During the forum, I was privileged to be confirmed as an "Honorary Commander" attached to the Test and Evaluation Squadron at Joint Base McGuire-Dix-Lakehurst (JBDL). It is a true honor for me to meet, work with, and highlight these great American patriots serving and defending our nation.
Successful Launch of A3Sat at University of Toledo, home of NASA GLOBE Mission Earth
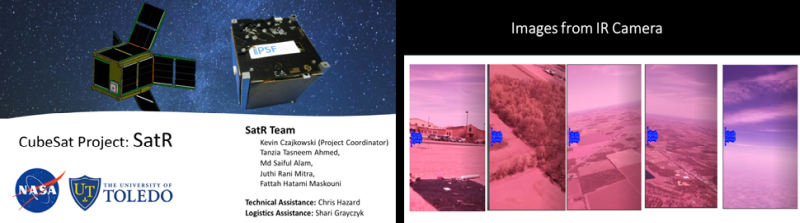
On May 5, 2023 the University of Toledo A3Sat Team successfully launched and recovered their High Altitude balloon (HAB). The Team’s future plans include using CubeSats to collect videos and air quality data during solar eclipse in October 2023.
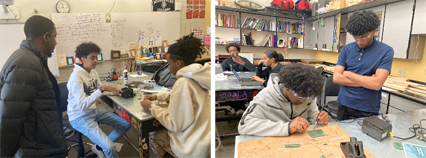
DSST Montview High School Colorado A3Sat Project
Their mission statement: "We will build the A3Sat CubeSat Emulator and launch it on a high-altitude balloon in order to empower communities, create opportunities to apply our skills and knowledge, and gain insight on the future of aerospace." We are looking forward to their soon expected successful launch and compile their results. While the original A3Sat design did not include use with a high altitude balloon, modifications were created to accommodate this launch mode. We are monitoring the success of these flights with great anticipation.
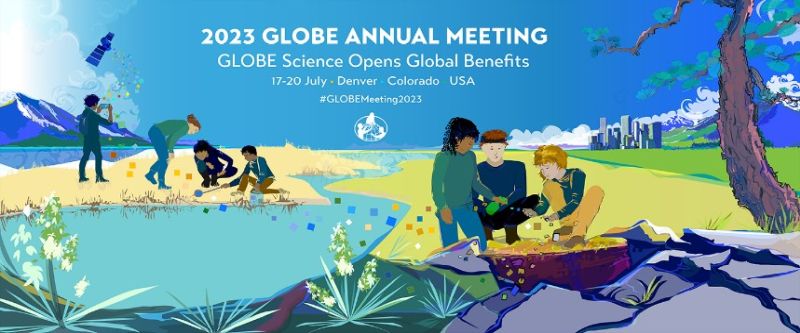
A3Sat at GLOBE Annual Meeting
At the 2023 GLOBE Annual Meeting in July, we will be present a panel discussing the next steps towards greater infusion of satellite education into the GLOBE Program internationally. The panelists will include Dr. Kevin Czajkowski (PI -NASA GLOBE Mission Earth), Dr. Mike Jabot, (Professor SUNY Fredonia), Mr. Charles Maina (Kenya Space Agency), Mr. Mark Brettenny (GLOBE Africa), Ms. Felicity Muench (One Voice for Change/CubeSats in Peru), and myself. Muich of the discussion will include the A3Sat Project. The A3Sat Emulator V 2.0 was designed to authentically replicate building a CubeSat for pre-college students and is an authentic STEM program with direct real-world applications. CubeSats have been engineered and launched into space by space agencies, universities and pre-college students around the world. While there are pre-college STEM education programs designing CubeSats with the hope of launching into space, there remains limited access to space, and the costs prohibit such endeavors at the majority of schools in the United States, and in other countries around the world. This panel discussion will highlight the impact on the GLOBE Program of international projects already underway that are authentic, participation-broadening STEM projects as well as internationally collaborative.
A3Sat Expands into South Africa
Through good friends and colleagues Prof. Hal and Dr. Bettye Walker, we will be introducing the A3Sat to students Hal and Bettye instruct and support. The Walkers created the first South Africa Chapter of the National Space Society (NSS) on the African continent, the Cape Town Space Society (CTSS). Mark Brettenny, GLOBE Arica Coordinating Office Director, CEO GIA Environmental Resource Development and Training (ERD&T), will also be coordinating activities within the South Africa GLOBE Program. Mark and I will be meeting during the GLOBE Annual Meeting this July in Denver CO. This new collaboration will be both challenging and exciting.
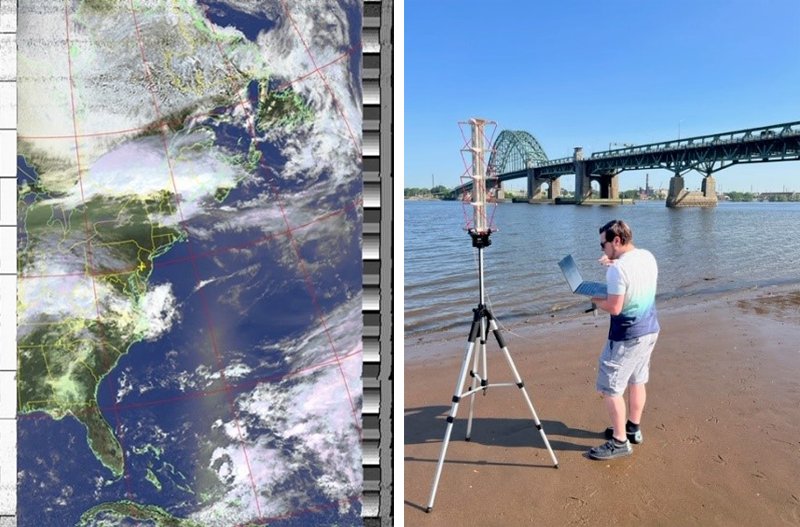
Presenting a 3D printed antenna for the next generation of students receiving weather satellite direct read-out in the classroom.
Remember when... The Satellites & Education Conference began in 1988 when teachers sharing a common interest in weather satellite direct read-out in the classroom were called together at West Chester University in Pennsylvania. The primary focus was engaging students in the reception of signals from NOAA polar-orbiting weather satellites producing images of the Earth in both visible and infra-red wave bands. There were many superior presentations and amazing vendors. Some offered do-it-yourself systems, others high-end commercial systems, and still others covered everything in between. There were several antenna designs to chose from including a crossed Yagi design that tracked the satellite as it passed overhead and a "turnstile" design that remained stationary.
Following the Acquire-Analyze-Apply (A3) model to teach where polar-orbiting satellite imagery comes from and how it is obtained and used, we have constructed a quadrifilar helical antenna using a 3D printer. This antenna has proven extremely successful in our early weeks of testing. We look forward to introducing it into classrooms around the world as an authentic STEM application.
This location provides an area for collaboration and the tools necessary to incubate the idea process to execution. It provides:
In partnership with MSgt Dean Morton (Superintendent of Innovation) and TSgt Andrew Chadbourn (Chief of Technology - 3D printing), we are working with both the A3Sat CubeSat and Polar Orbiting Antenna to create and improve elements of these tools, and we are discussing the creation of classes for military personnel and/or their children in their Innovation Lab.
Don’t forget the SmallSat Education Conference – Oct 28, 9:30 AM AST – Oct 29, 1:30 PM AST
For more information, visit https://www.smallsateducation.org/
Remember - "you can teach anything with satellites."
Stay safe - stay well!
For now, I'm John...and this is my Journey
[ Back to Top ]

From Sciencee https://www.science.org/content/article/it-s-just-mind-boggling-more-19-000-undersea-volcanoes-discovered
By Pasul Voosen
April 19, 2023
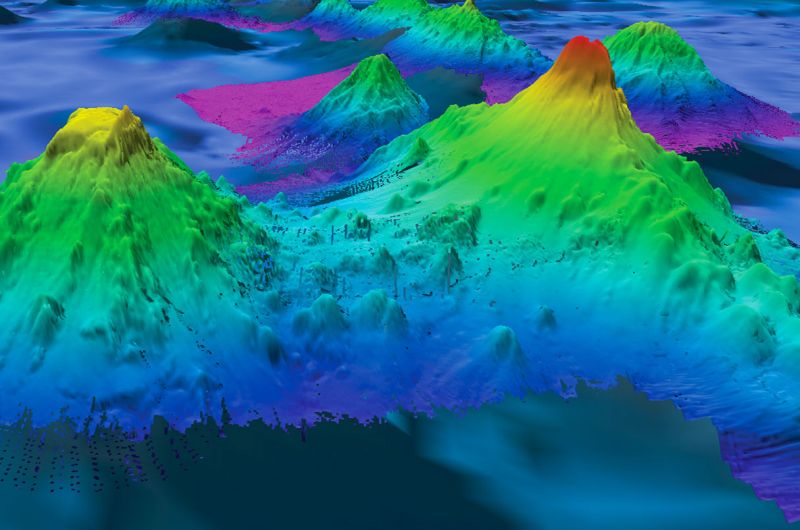
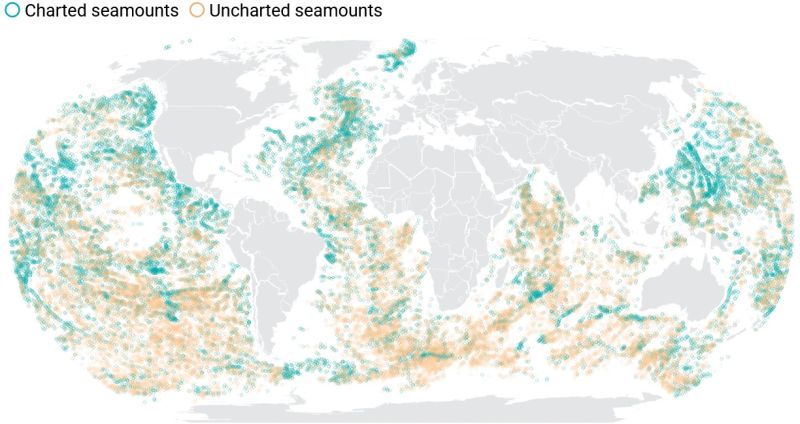
The U.S. submarine fleet’s biggest adversary lately hasn’t been Red October. In 2005, the nuclear-powered USS San Francisco collided with an underwater volcano, or seamount, at top speed, killing a crew member and injuring most aboard. It happened again in 2021 when the USS Connecticut struck a seamount in the South China Sea, damaging its sonar array.
With only one-quarter of the sea floor mapped with sonar, it is impossible to know how many seamounts exist. But radar satellites that measure ocean height can also find them, by looking for subtle signs of seawater mounding above a hidden seamount, tugged by its gravity. A 2011 census using the method found more than 24,000. High-resolution radar data have now added more than 19,000 new ones. The vast majority—more than 27,000—remain uncharted by sonar. "It’s just mind boggling," says David Sandwell, a marine geophysicist at the Scripps Institution of Oceanography, who helped lead the work.
Published this month in Earth and Space Science, the new seamount catalog is "a great step forward," says Larry Mayer, director of the University of New Hampshire’s Center for Coastal and Ocean Mapping. Besides posing navigational hazards, the mountains harbor rare-earth minerals that make them commercial targets for deep-sea miners. Their size and distribution hold clues to plate tectonics and magmatism. They are crucial oases for marine life. And they are pot-stirrers that help control the large-scale ocean flows responsible for sequestering vast amounts of heat and carbon dioxide, says John Lowell, chief hydrographer of the National Geospatial-Intelligence Agency (NGA), which runs the U.S. military’s satellite mapping efforts. "The better we understand the shape of the sea floor, the better we can prepare [for climate change]."
[ Back to Top ]
From National Centers for Environmental Information at https://www.ncei.noaa.gov/news/tracking-sea-surface-temperatures
May 23, 2023
Seawater temperature is a critical factor in the functioning of both marine and terrestrial ecosystems, as well as human activities that rely on the ocean. Sea surface temperature (SST) is the temperature of the uppermost layer of seawater, typically the top few meters. This layer is in direct contact with the atmosphere, and its temperature is influenced by a variety of factors, including solar radiation, wind, and currents. Monitoring changes in SST is essential for understanding and mitigating the impacts of climate change and other environmental stressors. Changes in global SST can also impact climate regimes over land through teleconnections, such as the well known El Niño and La Niña events.
The NOAA Extended Reconstructed Sea Surface Temperature (ERSST) dataset is an important product for studying long-term changes in the SST. It is widely used in climate research, weather forecasting, and other environmental applications.>
SST is a key indicator related to climate change because it describes conditions at the boundary between the atmosphere and the oceans, which is where the transfer of energy between the two takes place. As the oceans absorb more heat from the atmosphere, SST is expected to increase. Changes in SST can affect circulation patterns and ecosystems in the ocean and also influence global climate through the transfer of energy back into the atmosphere.
[ Back to Top ]


By Emily Becker, from ENSO Blog, Climate.gov at https://www.climate.gov/news-features/blogs/march-2023-enso-update-no-more-la-ni%C3%B1a
March 9, 2023
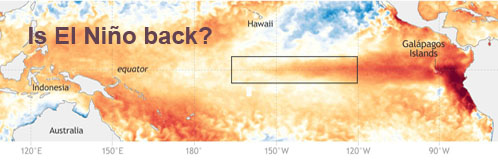
La Niña—the cool phase of the El Niño-Southern Oscillation (ENSO) climate pattern—has left the building! After a year and half of non-stop La Niña, the tropical Pacific ocean-atmosphere system has transitioned to neutral, allowing NOAA to issue its "Final La Niña Advisory". What can we expect for ENSO through the summer and into next fall and winter? I’ll get to that!
First, though, let’s bid La Niña adieu. The most recent weekly measurement of the sea surface temperature in the Niño-3.4 region (our primary monitoring region for La Niña and El Niño) was a mere -0.2°C (-0.4˚ F) compared to the long-term average. (To calculate a change in temperature in degrees Celsius to Fahrenheit, multiply by 1.8.) Also, the latest monthly value from the OISSTv2.1 dataset was -0.4°C (-0.7˚ F) for this same region. The threshold for La Niña is cooler than -0.5 °C, so we can say the ocean surface has moved away from La Niña.
The atmosphere is a little more complicated, as it tends to be! We still see some indications of a La Niña-like strengthened Walker circulation, with more rain and clouds than average over Indonesia, less over the central Pacific, and enhanced trade winds. However, without the cooler sea surface characteristic of La Niña, it’s likely this pattern will diminish in the coming weeks.
More information about the El Niño - Southern Oscillation (ENSO) can be found at What to Watch For: El Niño Likely to Develop This Summer and Watch La Niña Fade and El Niño Approach in the Tropical Pacific Ocean in 2023 and International Sea Level Satellite Spots Early Signs of El Niño.
[ Back to Top ]
By Sally Younger, NASA Jet Propulsion laboratory
May 31, 2023
Triggered by earthquakes, undersea volcanoes, and other Earth-shaking forces, tsunamis can devastate coastal communities. And when it comes to providing advance warning, every second counts. Scientists at NASA’s Jet Propulsion Laboratory are testing a novel approach to detect – from the far reaches of the atmosphere – the ocean’s deadliest waves.
Called GUARDIAN (GNSS Upper Atmospheric Real-time Disaster Information and Alert Network), the experimental monitoring system taps into data from clusters of GPS and other wayfinding satellites orbiting our planet. Collectively, these clusters are known as global navigational satellite systems, or GNSS. Their radio signals travel to hundreds of scientific ground stations around the world, and that data is crunched by JPL’s Global Differential GPS (GDGPS) network, which improves real-time positional accuracy down to a few inches (roughly 10 centimeters).
The new system sifts the signals for clues that a tsunami has arisen somewhere on Earth. How does it work? During a tsunami, many square miles of the ocean surface can rise and fall nearly in unison, displacing a significant amount of air above it. The displaced air ripples out in all directions in the form of low-frequency sound and gravity waves. Within several minutes, these vibrations reach the topmost layer of atmosphere: the Sun-cooked, electrically charged ionosphere. The ensuing clash of pressure waves with charged particles can distort the signals from nearby navigational satellites ever so slightly.
While navigation tools usually seek to correct for such ionospheric disturbances, scientists can use them as a lifesaving alarm bell, noted Léo Martire, a JPL scientist developing GUARDIAN. "Instead of correcting for this as an error, we use it as data to find natural hazards," Martire said.
[ Back to Top ]
From NOAA News & Features
April 24, 2023
NOAA’s Space Weather Prediction Center — a division of the National Weather Service — is monitoring a severe geomagnetic storm generated by a coronal mass ejection (CME) that erupted from the sun on April 21. NOAA forecasters issued several warnings for the geomagnetic storm over the weekend and provided decision support to customers so they could minimize impacts.
Ejected plasma from the eruption traveled at nearly two million miles per hour toward Earth, with NOAA observing the arrival of a severe geomagnetic storm (level 4 out of 5 on NOAA’s space weather G- scale) at 3:26 p.m. EDT on April 23. Geomagnetic storm conditions continued overnight. A watch for a moderate geomagnetic storm (G2) is in effect today.
"This increased activity from the sun is consistent with the current state and timing of the solar cycle," said Rob Steenburgh, NOAA space scientist. "Energetic events like solar flares and coronal mass ejections have become more frequent in the past year, and especially in the past month, and we expect activity to continue ramping up to the peak next year."
[ Back to Top ]


From NOAA National Weather Service at https://www.weather.gov/news/232604-space-weather-workshop
April 27, 2023
Space weather scientists, academia, industry, and end-users from across the world gathered in Boulder, Colorado last week at the Space Weather Workshop to discuss space weather impacts on various sectors, including satellites, electric power, and aviation. Attendees at the week-long conference spoke about building resilience through partnerships to space weather storms as we get closer to solar maximum and the importance of space weather modeling, observations, and prediction to protect systems that might be at risk from space weather effects.
"It was great to have Special Assistant to the President and the Deputy Homeland Security Advisor for Resilience and Response Caitlin Durkovich, Deputy Secretary of Commerce Don Graves, and Assistant Secretary of Commerce Dr. Michael Morgan at the workshop highlighting the importance of preparing for and mitigating the threats of space weather," said Dr. Howard Singer, chief scientist, NOAA’s Space Weather Prediction Center. "The workshop also offered an opportunity for space weather experts to share knowledge about space weather impacts and plans for future observations, modeling and services."
[ Back to Top ]
From NOAA News & Features at https://www.noaa.gov/stories/noaa-and-nsf-to-create-research-center-in-response-to-insurance-industry-climate-needs
May 16, 2023
Whether you own a home, a business, or other assets, insurance is an important part of any budgetary calculation involving protection of property. While the insurance and reinsurance sector are at the forefront of translating weather and climate information into financial and societal risks, the industry’s focus has been on use of catastrophe models rather than incorporating climate change data and projections that can help characterize future conditions.
A new agreement between NOAA and the National Science Foundation (NSF) will support the creation of an Industry-University Cooperative Research Center (IUCRC) focused on modeling catastrophic impacts and risk assessment of climate change to help better support the needs of the insurance sector.
"Traditionally, catastrophe modeling looks at past events while climate modeling looks to the future," said NOAA Chief Scientist Sarah Kapnick, Ph.D. "We need a new and improved way of combining these approaches in order to address the challenges that are being accelerated by our rapidly changing climate. Combining climate and catastrophe models with the goal of producing better decision making tools is a game changer for the insurance, reinsurance and mortgage industries. Additionally, we need to not only develop the science and tools in this space, but also the workforce capacity to put knowledge into action."
[ Back to Top ]
By Keelin Haynes, Mary Mitkish, Brian Barker from NASA Harvest: Earth Data for Informed Agricultural Decisions at https://nasaharvest.org/news/new-global-crop-type-maps-will-improve-analysis-global-agricultural-production
May 16, 2023
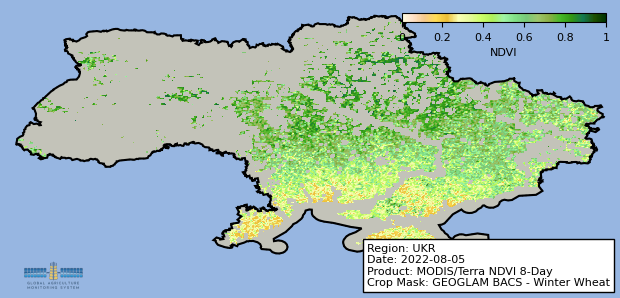
A team of remote sensing and agricultural scientists from NASA Harvest and GEOGLAM have created the first up-to-date harmonized global crop type maps for five major commodity crops. Built with an easily-updated framework, our maps will be annually-adjusted, allowing for continued analysis based on most recently available data.
Climate change, a burgeoning population, severe weather events, and conflict can significantly impact agricultural productivity, destabilizing markets and therefore food prices for global consumers. Our team of international remote sensing and agricultural scientists is helping overcome these challenges by producing the first up-to-date global crop type maps for five major commodity crops: maize, winter wheat, spring wheat, soybeans, and rice. Created by harmonizing more than 20 datasets from a variety of national, regional, and global entities; our publicly available and annually updated crop type maps strengthen national and international responses to adverse agricultural events across the world.
Global food security is facing increased pressure from a changing climate and a growing population. Certain crops play a major role in feeding the world. Commonly called commodity crops, these include maize, wheat, soybeans, and rice. The success of these four crops plays a major role in not just keeping the world fed, but they also have a significant impact on global commodity crop markets and food prices. Understanding the condition of these crops around the world throughout the growing season is critical in stabilizing these markets.
The AMIS (Agricultural Market Information System) and GEOGLAM (Group on Earth Observations Global Agricultural Monitoring) initiatives are two such international efforts – commissioned by the G20 Ministers of Agriculture in response to the food price crises of 2007/08 and 2010. One of the key activities supporting global agricultural commodity market transparency is the GEOGLAM Crop Monitor for AMIS, a monthly, publicly accessible, data-driven report on global crop conditions.
AMIS acts as a forum for economists and policymakers to enhance food market transparency, analyze global crop conditions, and coordinate policy action/response, whereas GEOGLAM is focused on improving crop monitoring capabilities, through in situ (ground) data and satellite Earth observations.
For more information about normalized difference vegetative index (NDVI), see "Land Cover Change" lesson plan in the SEA Lesson Plan Library.
[ Back to Top ]


From NASA Jet Propulsion Laboratory at https://www.jpl.nasa.gov/news/nasas-chandra-webb-telescopes-combine-for-arresting-views
May 23, 2023
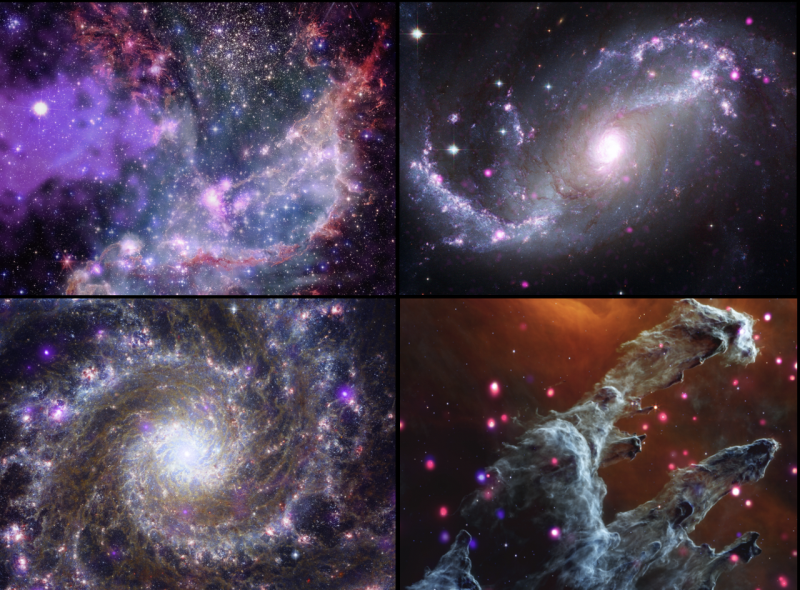
Four composite images deliver dazzling views from NASA’s Chandra X-ray Observatory and James Webb Space Telescope of two galaxies, a nebula, and a star cluster. Each image combines Chandra’s X-rays – a form of high-energy light – with infrared data from previously released Webb images, both of which are invisible to the unaided eye. Data from NASA’s Hubble Space Telescope (optical light) and retired Spitzer Space Telescope (infrared), plus the European Space Agency’s XMM-Newton (X-ray) and the European Southern Observatory’s New Technology Telescope (optical) is also used. These cosmic wonders and details are made available by mapping the data to colors that humans can perceive.
Beginning in the upper left and moving clockwise, the objects are:
[ Back to Top ]
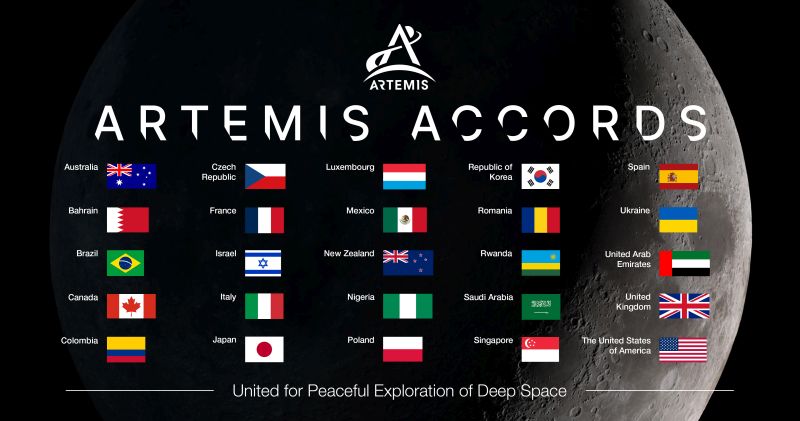
In a time when the race to Moon and Mars involve both public and private sectors, and a lack of civil behavior dots too many headlines, the Artemis Accords remind us of a future with possibilities.
From From NASA at https://www.nasa.gov/specials/artemis-accords/index.html
Through Artemis, NASA aims to land the first woman and first person of color on the Moon, heralding a new era for space exploration and utilization.
While NASA is leading the Artemis missions, international partnerships will play a key role in achieving a sustainable and robust presence on the Moon while preparing to conduct a historic human mission to Mars.
With numerous countries and private sector players conducting missions and operations in cislunar space, it’s critical to establish a common set of principles to govern the civil exploration and use of outer space.
The Artemis Accords will describe a shared vision for principles, grounded in the Outer Space Treaty of 1967, to create a safe and transparent environment which facilitates exploration, science, and commercial activities for all of humanity to enjoy.
The Accords... |
|
|
On May 30, Spain became the 25th Artemis Accords signatory.
[ Back to Top ]


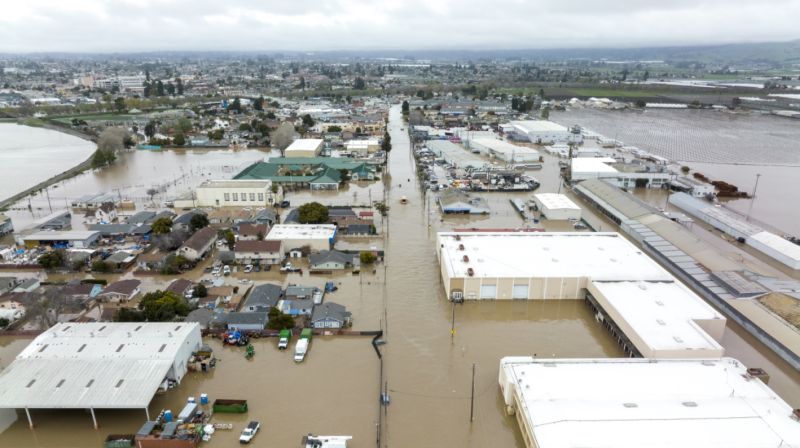
El Niño conditions are characterized by unusually warm ocean temperatures in the Eastern Equatorial Pacific. These sea surface temperature variations affect changes in weather systems around the world. Each regional and local weather system is uniquely affected by a strong El Niño event. In some regions there are major floods, in others major droughts. Some places are cooler than usual, some places warmer; all related to El Niño events.
While a strong El Niño event seems a distant occurrence from many homes, the global connectedness of all Earth Systems tells a story of the need for awareness and preparation for potential hometown impacts. The 2015-2016 El Niño event brought excessive rains and flooding to the American Gulf Coast states, the U.S. Pacific Northwest, and regions of Peru. Climate Prediction Center data suggests we may be emerging from a La Niña conditions that have contributed to the drought in the western states of the U.S. and entering an El Niño event. Atmospheric rivers brought heavy rain and snow late in the winter season for Pacific Coast states like California. The extra moisture brought green grasses, wildflowers, and spring growth that could become extra fuel for wildfires as they dry in the summer heat. Spring snow melt promises to swell rivers and streams. Is there a relationship between the El Niño-Southern Oscillation (ENSO) and the rain and flooding in the wildfire torn areas of the western states? Is there a relationship between the ENSO and the North Atlantic hurricane season?
What happens when El Niño conditions arise and people are not prepared for the impact?
| Grade Level: | 6-12 |
| Time Requirement: | Part 1: 2-3 class periods |
| Part 2: 1-2 class periods | |
| Part 3: 1-2 class periods | |
| Prerequisites: | Basic computer skills |
| Relevant Disciplines: | All |
[ Back to Top ]
Share your satellite-based lesson ideas with the teaching community.
Send us a full lesson plan, or simply suggest a lesson idea. If you found the idea online, please share the source as well. The lesson can be about anything that helps connect learners with satellite-based technology - any grade level K-12 - any STEM subject area or geography.
"Satellite-technology" includes any part of the science, math, engineering, or technology of satellites, rockets, and remote sensing instruments as well as the use of any environmental satellite data to explore questions related to aspects of global change and local impacts in the long term, short term, and catastrophic time frames. Of special interest are lessons providing opportunities for learners to inquire, experiment, and apply mathematics.
Perhaps you designed a lesson yourself - we will happily prepare it for future publication in More Lessons from the Sky and inclusion in the SEA Lesson Plan Library. Perhaps you found a worthy lesson plan published elsewhere - we can research it inclusion in a lesson plan spotlight. In either case, you will receive full credit for developing and/or bringing the lesson to the attention of the teaching community. Don't forget to share your insights if you tried the lesson with students.
Please share your ideas at SEA.Lessons@SatEd.org.
[ Back to Top ]

![]()

This edition of the SEA Newsletter was produced in HTML5.
It is best viewed with most recent updates of Firefox, Edge, Chrome, Opera, or Safari.
©Satellite Educators Association, Inc. https://SatEd.org SEA.Newsletter@SatEd.org
Satellite Educators Association, Inc. is a 501(c)(3) non-profit educational organization.
In 2023, the SEA Newsletter changed from monthly to quarterly publication (March, June, September, and December). The SEA Newsletter is published on-line and available at no cost.
SEA terms, conditions, policies, and contact information are detailed HERE.
Unless otherwise listed, all photo and image credits are the authors of the articles.
Any opinons expressed in this Newsletter are those of the authors
and not necessarily those of the Satellite Educators Association, Inc.
or any of its officers, members, or representatives.
Many SEA Newsletter items contain third-party links to sites not governed by Satellite
Educators Association, Inc. The viewer is cautioned to be aware of the terms of use and
privacy policies for those third-party sites.
![]()