

OUR VISION
The world's finest educators supporting science, technology, engineering, and math (STEM) learning for pre-kindergarten to post-graduate students using real-world applications from satellites and satellite data.
OUR MISSION
To enhance the education environment to excite students about science, technology, engineering, and math through space-based technology -- satellites and satellite data.

Martin Luther King, Jr.

For there is but one essential justice which cements society, and one law which establishes this justice. This law is right reason, which is the true rule of all commandments and prohibitions. Whoever neglects this law, whether written or unwritten, is necessarily unjust and wicked.
Marcus Tullius Cicero

TABLE OF CONTENTS
Click a RED link to view article
In This Issue
Input from Ron
John's Journey
ACCESS
ANALYZE
APPLY
In the News
For Teachers
More Lessons
from the Sky

September 1, 2023
Following the A3 model, articles in this Fall issue of SEA Newsletter, are offered in three sections.
In Access, see NASA's first images from a new pollution-monitoring instrument, stunning images of the Sun from two spacecraft making a close Earth-approach after 17 years, and read about how USGS contributes maps and imagery to hurricane response.
The Analyze section offers stories of the satellites monitoring increased storm activity in both the Atlantic and Pacific Oceans, how TROPICS provides multiple views of intensifying hurricanes, and the globe's record-breaking heat wave.
The third section, Apply, speaks of increasing trend of coastal flooding with increasing severe storm activity, how NASA satellites found wine grape disease in California, advances in NOAA space weather's prediction and product updates, and satellite tracking historic levels of harmful wildfire smoke.
Of course, don't miss Association News which offers participation in the SmallSat Education Conference and seeks your help with this newsletter. For Teachers brings a new list of student opportunities. Our expert SEA columnists write about Hawai'ian wildfires and trends in education related to satellite technology. Items of interest In the News highlight the impact of low-Earth-orbit satellites on weather forecasting, spotlight an important but rarely heard of remote-sensing instrument, and a remarkable image of the Martian surface from helicopter Ingenuity. More Lessons From the Sky offers a new and updated version of the Model Remote Sensor lesson plan for upper middle and high school.
Enjoy!
--Editor

[ Back to Top ]

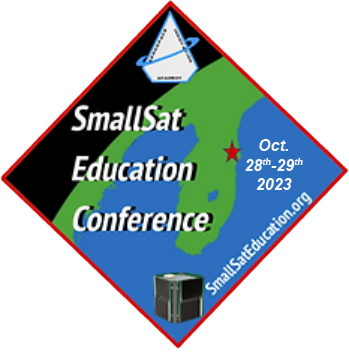
Have you registered for the SmalSats Education Conference yet? It's not too late! Registration is open online at https://www.smallsateducation.org/event-details/2023-smallsat-education-conference.
For more than a third of a century, the Satellite Educators Association (SEA) annually produced the outstanding Satellites & Education Conference bringing teachers together with representatives from government agencies (especially NOAA and NASA), aerospace industry (Aerospace Corp, Raytheon, Boeing, Northrop Grumman, among others), and university research -- all focussed on helping teachers engage learners with satellite related technologies. This year, in lieu of Satellites & Education Conference XXXVI, the SEA is helping sponsor the SmallSats Education Conference, October 28-29, 2023, at Kennedy Space Center in Florida.
Following the highly successful first SmallSat Education Conference in October 2022, the 2023 conference promises to be a "gathering where educators, administrators, and students will learn about CubeSats, ThinSats, and High Altitude Balloon programs." The "target audiences are faculty and students from middle school through college." The event includes a strong student presence reminiscent of SEA's M.Y. S.P.A.C.E. Program (https://SatEd.org/MYSPACE/MYSPACE.htm). Members of the SEA Executive Committee have been actively participating in planning this conference, and SEA members have submitted presentation proposals.
Don't miss this exciting conference along with a chance to visit Kennedy Space Center. Register today https://www.smallsateducation.org/event-details/2023-smallsat-education-conference.
Let's approach that from a historical perspective...
The first Satellites & Education Conference (1988) and the foundation of the Satellite Educators Association (1989) was accomplished by teachers interested in using weather satellite direct read-out with students in the classroom. The early equipment included a home-built antenna, a short-wave radio capable of receiving frequencies just below the amateur radio 2-meter band, and a used/refurbished wet paper facsimile printer. A special, circular slide rule-like calculator produced by NOAA was used to predict the location and timing of an overhead pass by a NOAA polar-orbiting weather satellite using updated orbital elements mailed periodically from NOAA on postcard. A receiving station in Southern California, for example, could receive a real-time image of the Earth from Cabo San Lucas in Baja California to Alaska with a width from just east of the Rocky Mountains to half-way to Hawaii. Other direct read-out stations could receive real-time imagery with similar length and width relative to their geographical locations.
Those gathered at the first Satellites & Education Conference discussed how teachers with receiving stations in Washington, Southern California, Maine, Pennsylvania, Florida, and England might share such imagery to develop a broader, more global perspective with students -- a major problem since all were equipped with 2400 baud MODEMs on dedicated telephone numbers and very few, if any, classroom computers.
Within a few short years, two important developments provided the solution as well as a significant boost to interest in the Satellites & Education Conference: classroom computers and the Internet. It was a time when desktop computers were becoming more available for schools and student use. Satellite tracking, data visualization, and image analysis provided a viable answer to the standard question of, "OK. Now we have computers. What are we going to do with them?" Shortly thereafter, the availability of the World Wide Web and Internet quickly expanded during the 1990s. With continued support from NOAA, NASA, and the U.S. Navy, the Satellites & Education Conference met a need and flourished.
Nearly six decades of satellite-based remote sensing data have been processed and archived by NOAA, NASA, and the USGS, among others, and made freely available via the Internet. Advanced computer technology (compared to 1990) is in the hands of every person with a mobile phone, and many organizations provide their own visualizations of data. Today, the next important development, Small Sats, has entered the picture: CubeSats, single, stacked, or in arrays; picosats; simulators, emulators; balloon-launched or rocket-launched. Small Sats make satellite engineering and technology accessible to middle school, high school, and college students at an affordable cost.
To learn more about Small Sats in your classroom, SEA invites and urges you to attend the SmallSats Education Conference, October 28-29 at Kennedy Space Center.
To recap, the SmallSat Education Conference is focused on educational opportunities and curricula for community college, high school, and middle school faculty and students. It is scheduled for October 28-29, 2023 at Kennedy Space Center in Florida. Registration is now open online with Special rates available for attending students and teachers. Please visit https://www.smallsateducation.org/event-details/2023-smallsat-education-conference for more information and registration.
Don't wait! Register today!
[ Back to Top ]
You are invited to join the SEA Newsletter Committee as Editor, Columnist, Contributor (occasional), or Reviewer.
Working with the SEA Newsletter Committee is enjoyable and helps keep one in touch with what's happening. There is always room for qualified, interested, people who want to help. The more people helping, the easier the job of the editor. Currently, the regular columnists and occasional contributors work from home and communicate with the Editor and each other by e-mail.
Anyone who would like the pleasure of helping - a little or a lot - please contact the SEA Executive Committee at SEA.Newsletter@SatEd.org. Any suggestions for changes you would like to see in the SEA Newsletter, contact us at the same address.
The SEA Newsletter has its roots in a printed-and-mailed version called InfoSEA published by Nancy McIntyre's Educational Center for Earth Observations at West Chester University, Pennsylvania, starting in the mid-1990s to coordinate the annual Satellites & Education Conferences held at that location. With the closing of Nancy's office in 2001, InfoSEA and the fledgling SEA Web site ended. SEA moved the Satellites & Education Conference to California State University, Los Angeles and initiated the M.Y. S.P.A.C.E. Program in 2002. (See SEA History.)
Vic Everett stepped up as SEA's new Web Administrator and inaugurated the SatEd.org Web site in 2004. The new, online version of the SEA Newsletter was created several years later. On Vic's passing in 2015, Pete Arvedson offered temporary help to keep the Newsletter afloat until a new editor was found. Arvedson will be stepping back at the end of the year for health reasons; the December 2023 quarterly issue will be his last as editor.
Keep the SEA Newsletter alive! Join the SEA Newsletter Committee. Contact any SEA officer at SEA.Newsletter@SatEd.org for more information and to help.
[ Back to Top ]


By Ron Gird, Meteorologist and former Satellite/Spaceflight and Outreach Program Manager for the National Weather Service
Hi Folks.
I would caution all readers of the SEA Newsletter not to "rush to judgment" regarding the recent fires in Maui. I continue to read as much as I can, but, as of this writing, I cannot yet wrap my head around what happened in Maui. I have read articles blaming "climate change" and I have read articles suggesting other atmospheric forces were at play...somewhat similar to the "perfect storm" and the lobster fisherman who lost their lives in a New England winter storm in 1991. For now continue reading and have an open mind about the Maui fires. A very tragic event! The annual meeting of the American Meteorological Society will be held in January 2024 in Baltimore, MD. It is almost certain there will be sessions on the Maui fires. I plan to attend and report back to SEA readers in 2024.
Meanwhile, may I draw your attention to these two articles offering viewpoints to be considered about the wildfires in Maui.
-Ron
ByBob Henson and Jeff Masters
From Yale Climate Connections
August 10, 2023
at https://yaleclimateconnections.org/2023/08/what-caused-the-deadly-hawaii-wildfires/
Unusually strong winds, drought, and invasive species teamed up to drive a compound catastrophe.
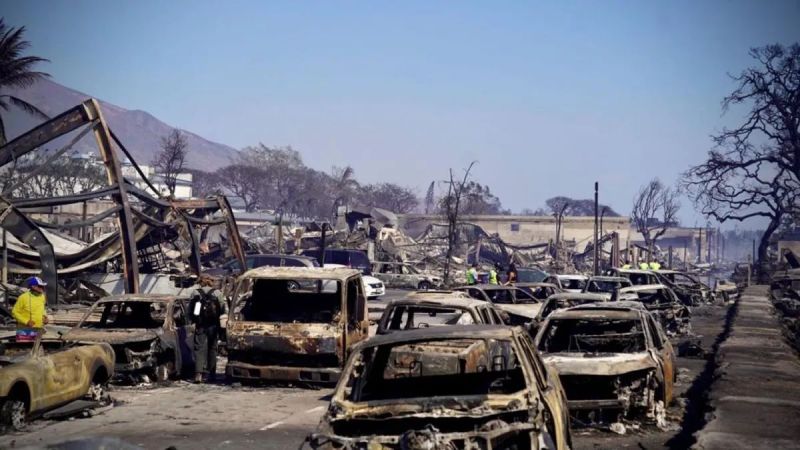
The deadliest and most destructive U.S. wildfires of 2023 thus far swept through Hawai'i on Tuesday night and Wednesday, Aug. 8-9. At least 36 deaths had been reported from the fires by early Thursday, with an uncertain number of people injured. The worst damage was on Maui, where the central part of Lahaina (pop. 12,000) was largely destroyed. More than 271 structures in Lahaina had been affected, Maui County authorities reported in a news release late Wednesday. Two other blazes, the Upcountry and Pūlehu fires, destroyed several homes elsewhere on Maui. Three fires were in progress on the island of Hawai‘i, but no injuries or structural losses had been reported by late Wednesday, according to the Associated Press. Update: Maui County announced on Sunday, August 13, that the death toll from the Lahaina Fire was up to 93, as reported by the Associated Press. This makes it the deadliest U.S. wildfire in more than a century, as detailed at the bottom of this point. The toll is expected to rise even further as searchers canvass more of the affected area. More than 2,200 structures were damaged or destroyed in the Lahaina Fire; more than 500 others, mostly homes, were affected by Maui’s Upcountry Fire.
From Cliff Mass Weather Blog
August 2023
at https://cliffmass.blogspot.com/2023/08/the-real-cause-of-maui-wildfire-disaster.html
TThis blog will discuss the key reason for the Maui disaster, one not discussed by the media and others: a high amplitude atmospheric wave forced by strong winds interacting with the mountains of northwest Maui.
An atmosphere wave that produced powerful, dry downslope winds on the western slopes of West Maui mountains.
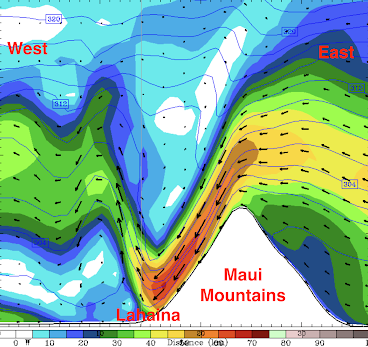
The terrible disaster in Maui has been leading the news cycle for a week now, with media and others proposing many causes: climate change, drought, dry invasive grasses, and Hurricane Dora to name a few.
But none of them have identified the key reason why so many people died last week and why the damage was so extensive. None explained the 60-90 mph gusts that hit a very localized area. Winds strong enough to shear off wooden power poles, tear roofs apart, and down lines of power lines.
And it wasn't Hurricane Dora, a relatively small tropical storm that passed 700 miles to the south of Hawaii.
Something else happened in Maui last week. Something capable of creating intense wind damage in one location and light winds a few miles away.
[ Back to Top ]


By John D. Moore, Executive Director, Institute for Earth Observations at Palmyra Cove, New Jersey
The emergence of studying the Earth as a system in the 1980’s led to the establishment of Earth System Science. Similarly, Earth Observing Satellites today are not only a single topic of discussion, but also highlight how those data represent a piece of a larger puzzle, like the sum of the parts, when investigating the functionality of the entire planet. Satellites working together are building a more comprehensive understanding of changes in the planet, such as climate change. A great example of satellites working together is the Afternoon Constellation (the “A-Train” satellite formation) which currently consists of five satellites flying in close proximity: Aqua, CloudSat, CALIPSO, PARASOL and Aura. While it may be categorized as a part of the current emphasis on climate change, specific investigations of A-Train satellites include landcover, clouds, soils, water, severe weather, food production, and more -- systems within the Earth System, but viewed in its entirety as THE Earth System.
Another example is the Harmonized Landsat Sentinel-2 (HLS) project that is an extension of research conducted at NASA's Goddard Space Flight Center in Greenbelt, MD. The HLS project takes “input data from the joint NASA/USGS Landsat 8 and Landsat 9 and the ESA (European Space Agency) Sentinel-2A and Sentinel-2B satellites to generate a harmonized, analysis-ready surface reflectance data product with observations every two to three days.”
For decades, satellite-based observations of the Earth have contributed to an evolving provided a global data base that presents an opportunity to truly learn about our planet home and understanding how it functions on a global scale. The A-Train and HLS Project are but two examples of such “technological collaborations.” Another is the increase in NASA/NOAA joint missions exemplified by data and imagery connections between a GOES satellite, a Polar Orbiting satellite, and CubeSats, such as the recent TROPICS CubeSats. Taken together, these examples tell us that investigating the impacts of climate change is both critical and challenging in scope, resolution, and timing.
An educational approach that I have developed over the years is call Earth SySTEM -- students investigating our planet through the lens of satellites and remote sensing. Using Geosciences is one of but a few authentic applications of using STEM as an approach to learning. The Geosciences community is by its very nature interdisciplinary, the diversity of technologies currently used is only rivaled by the Bio-Medical field, and the engineering and mathematics of such remote sensing technologies speak for themselves. This approach was the driving philosophy of the 2015 AMS adopted policy statement “Earth System Science, Technology, Engineering, and Mathematics Education” that I chaired. Ron Gird worked with me on that committee.
As federal agencies, and their departments or divisions, break down their silos, these next generation collaborations can advance the quest for solutions.

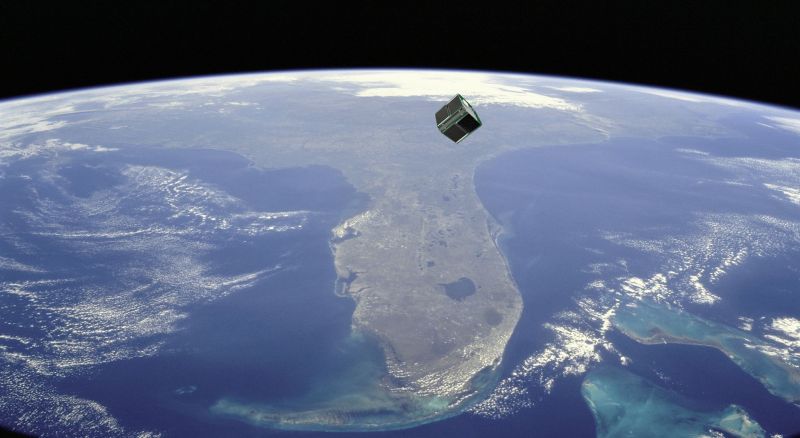
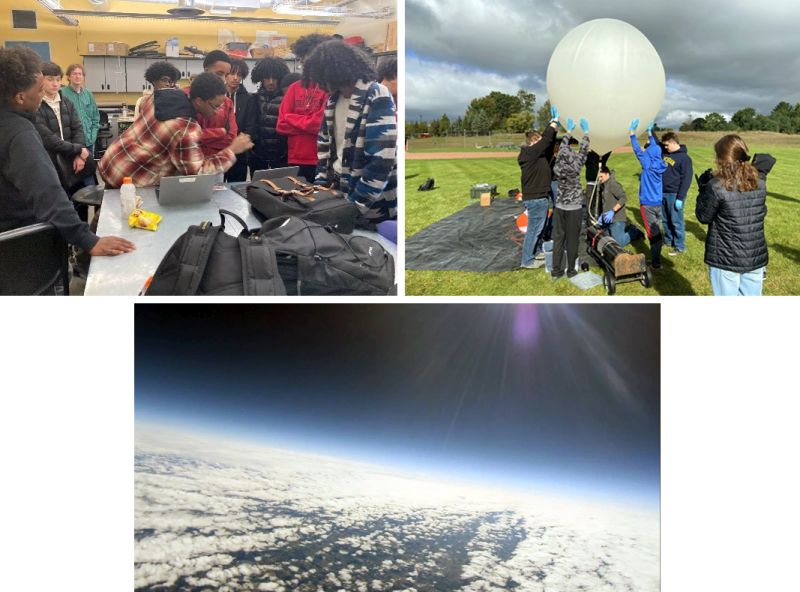
The body of evidence of students taking on new challenges – seen as they create their own satellite projects, conduct high altitude balloon (HAB) flights, and gather their own remote sensing data, is ever growing larger. Pictured below are students from the Denver School of Science and Technology (DSST) in Colorado assembling the A3Sat in their lab which enjoyed a very successful HAB flight. Pictured on the right is the Stockbridge High School, MI, students launching their HAB to capture an image from the upper atmosphere; and, below, their captured near-space portrait of Earth.
The A3Sat program has transitioned students from collecting ground data and using satellite-based remote sensing data and imagery into the world of building small satellites and obtaining data from their onboard sensors. (Can the reverse also work? Can we successfully transition students from building small satellites and obtaining data from their onboard sensors to analyzing and applying collected satellite-based remote sensing data? Guidelines for getting started can be found in "Using Satellites in Education" at https://SatEd.org/satellites.htm. But that is a discussion for another time.) For now, there is enough documentation and data to claim the A3Sat program a success in its engineering and educational objectives. From building the A3Sat Emulator to creating positive pathways forward, the impact on students' lives is undeniable as their focus and enthusiasm soars.
At the last Satellite Educators Association, Inc. (SEA) meeting, there was an extended discussion of great interest about potential new directions for SEA. One of the questions asked was, "As we look back through SEA's history, is there evidence of the impacts on student performance/success or student research resulting from learning about applications of satellite imagery and remote sensing?" I think there is clear evidence of this in the program results as well as foundational principles and goals of SEA's M.Y.S.P.A.C.E. Program (Multi-national Youth Studying Practical Applications of Climatic Events). See https://SatEd.org/MYSPACE/MYSPACE.htm#about.
I would also cite some of the work accomplished in the GLOBE Student Research Programs which include the Student Research Symposiums and the International Virtual Science Symposium. While GLOBE focuses on students using the GLOBE Protocols for their data, there has been limited support for students' research based solely on satellite and remote sensing data. This is unfortunate, especially since NASA is the lead federal agency that supports GLOBE. After several discussions with Dr. Amy Chen, GLOBE Program Manager in the NASA Earth Science Division, Dr. Chen committed to attending my presentation highlighting the impact of the GLOBE Program and the expansion of A3Sat into pre-college and university programs in Peru, Kenya, and South Africa. Additionally, there is a marked "ground swell" of satellite and remote sensing enthusiasts associated with GLOBE. They certainly made their presence known at the most recent GLOVE Annual Meeting. I sincerely hope this marks the start of a new level of global learning and observations to benefit the environment.
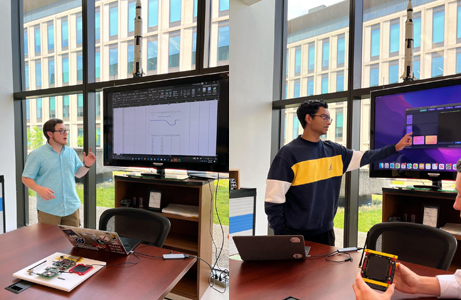
Pausing for a moment of reflection on the impacts of SEA’s focus on using satellite-based remote sensing data and my own Career Technical Education (CTE) lens, some of my students over the years are pictured below.


One final reminder: The SmallSat Education Conference will be held at NASA's Kennedy Space Center October 28-29, 2023. I highly recommend attendance especially since SEA is a major conference sponsor this year. More information about the conference and how to register can be found at https://www.smallsateducation.org/. It is a definite stop on my Journey ahead.
Remember - "you can teach anything with satellites."
Stay safe - stay well!
For now, I'm John...and this is my Journey
[ Back to Top ]


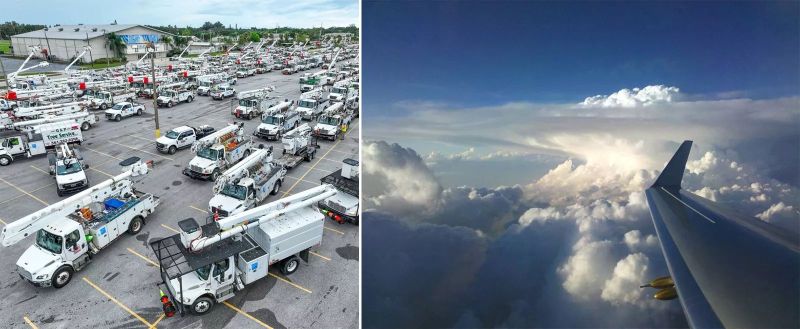
From USGS Communications and Publishing
at https://www.usgs.gov/news/featured-story/usgs-provides-maps-and-imagery-hurricane-response
July 14, 2023
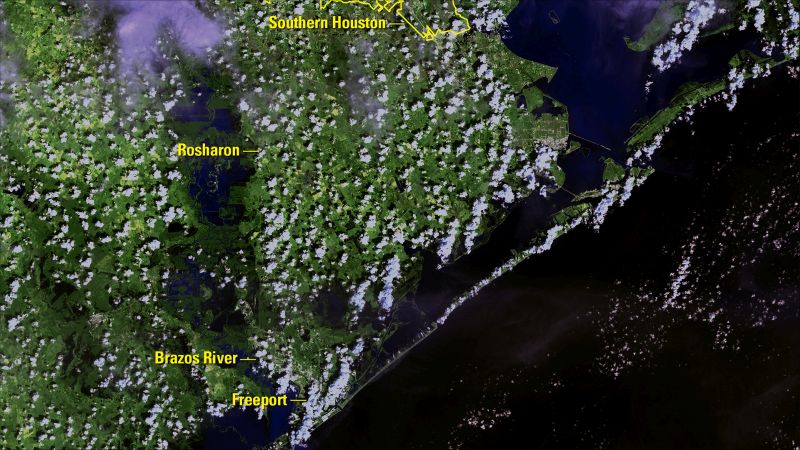
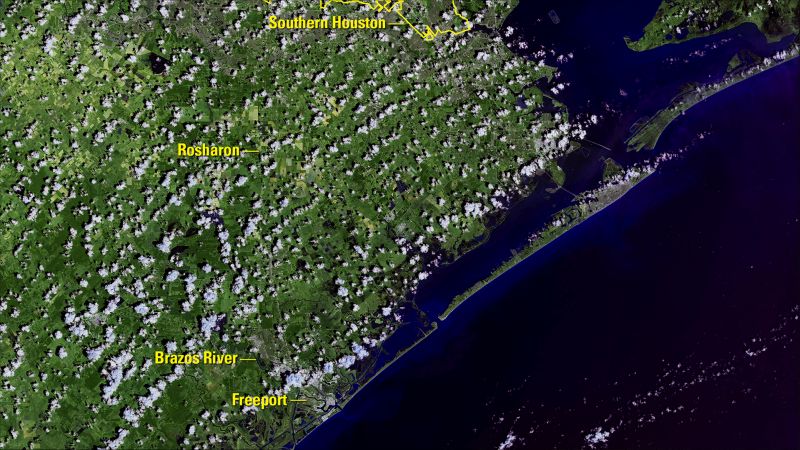
The U.S. Geological Survey is well-known for providing the nation high-quality geologic and topographic maps. A lessor known role the USGS fills during some hurricanes and tropical storms is providing disaster response communities access to a variety of state-of-the-art geospatial data, tools, maps, imagery, elevation data and more. These products can aid local, state and federal agencies as they make decisions that can protect lives and property.
First responders often rely on the USGS National Geospatial Program, which collects, archives and shares digital records of the nation's topography, natural landscape and human-made environment. The program's Geospatial Information Response Team works within the USGS and with partner agencies to provide key information to those responding to a major hurricane or other hazard. Some of this information is shown on event support maps built as a multi-layered mapping applications that provide a big-picture view of a storm's impacts, or a close-up of a specific community.
For this hurricane season, the GIRT has a newly designed, publicly available Event Support Map HUB site that offers access to applications, resources and information for hurricanes and other natural disasters. The site combines all major hazards under a single application for quick access and viewing that can be used by the public and decision makers for situational awareness and visualization during hazard events. Click here to view the public site.
[ Back to Top ]
By Karen Fox, Katherine Rohloff, NASA, and Charles Hatfield, Langley Research Center
at https://www.nasa.gov/press-release/nasa-shares-first-images-from-us-pollution-monitoring-instrument
August 25, 2023
On Thursday, NASA released the first data maps from its new instrument launched to space earlier this year, which now is successfully transmitting information about major air pollutants over North America. President Biden and Vice President Harris believe that all people have a right to breathe clean air. Data from the TEMPO mission will help decision makers across the country achieve that goal and support the Biden Administration's climate agenda — the most robust climate agenda in history.
From its orbit 22,000 miles above the equator, NASA's TEMPO, or Tropospheric Emissions: Monitoring of Pollution, is the first space-based instrument designed to continuously measure air quality above North America with the resolution of a few square miles.
"Neighborhoods and communities across the country will benefit from TEMPO's game-changing data for decades to come," said NASA Administrator Bill Nelson. "This summer, millions of Americans felt firsthand the effect of smoke from forest fires on our health. NASA and the Biden-Harris Administration are committed to making it easier for everyday Americans and decision-makers to access and use TEMPO data to monitor and improve the quality of the air we breathe, benefiting life here on Earth."
Observations by TEMPO will significantly improve studies of pollution caused by rush-hour traffic, the movement of smoke and ash from forest fires and volcanoes, and the effects of fertilizer application on farmland. In addition, TEMPO data will help scientists evaluate the health impacts of pollutants and aid in the creation of air pollution maps at the neighborhood scale, improving understanding of disparities in air quality within a community. Data will be shared with partner agencies that monitor and forecast air quality, such as the Environmental Protection Agency and the National Oceanic and Atmospheric Administration.
[ Back to Top ]
By Miles Hatfield, NASA Goddard Space Light Center at https://www.nasa.gov/feature/goddard/2023/sun/after-seventeen-years-a-spacecraft-makes-its-first-visit-home
August 17, 2023
On Aug. 12, 2023, NASA’s STEREO-A spacecraft will pass between the Sun and Earth, marking the first Earth flyby of the nearly 17-year-old mission. The visit home brings a special chance for the spacecraft to collaborate with NASA missions near Earth and reveal new insights into our closest star.
The twin STEREO (Solar TErrestrial RElations Observatory) spacecraft launched on Oct. 25, 2006, from the Cape Canaveral Air Force Station in Florida. STEREO-A (for "Ahead") advanced its lead on Earth as STEREO-B (for "Behind") lagged behind, both charting Earth-like orbits around the Sun.
During the first years after launch, the dual-spacecraft mission achieved its landmark goal: providing the first stereoscopic, or multiple-perspective, view of our closest star. On Feb. 6, 2011, the mission achieved another landmark: STEREO-A and -B reached a 180-degree separation in their orbits. For the first time, humanity saw our Sun as a complete sphere.
"Prior to that we were 'tethered' to the Sun-Earth line – we only saw one side of the Sun at a time," said Lika Guhathakurta, STEREO program scientist at NASA Headquarters in Washington, D.C. "STEREO broke that tether and gave us a view of the Sun as a three-dimensional object."
Continue reading to see visually stunning images of our Sun: composite view of both sides of the Sun simultaneously (Jan. 31, 2011), a 3D view of the Sun (July 6, 2023 - Get out your red-blue anaglyph glasses for this one!), and inside a coronal mass ejection (July 17, 2023).
[ Back to Top ]


From NOAA National Environmental Satellite, Data, and Information Service at https://www.nesdis.noaa.gov/news/noaa-satellites-monitor-increased-storm-activity-the-atlantic-and-pacific
August 24, 2023
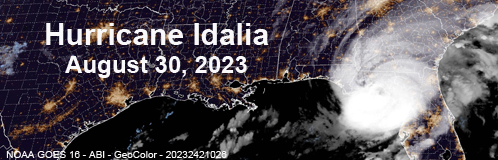
August 20 marked the beginning of what is typically the most active portion of the Atlantic hurricane season, and NOAA satellites are closely monitoring the action. Historically, more than 85 percent of all major (Category 3, 4, and 5) Atlantic hurricanes form after this date. In fact, hurricane experts at Colorado State University even ring a bell every year to mark the occasion.
In the eastern Pacific, there also tends to be a peak in activity during late August, but it's less pronounced than in the Atlantic. Here, relatively high levels of activity tend to be spread out over a longer portion of the season than in the Atlantic, with most tropical cyclones occurring between late June and early October.
This proved to be true this year when on August 14, a low-pressure system developed off the southern coasts of Mexico, Guatemala, and El Salvador. This disturbance strengthened into Tropical Storm Hilary on August 16 and became a hurricane the following day. Hilary continued to rapidly intensify, reaching Category 4 strength by August 18 with sustained winds of 145 mph. The same day, the National Hurricane Center issued the first-ever tropical storm watch for Southern California, while the Weather Prediction Center issued the first-ever level 4 (high risk) for flash flooding in the desert valleys of Southern California.
[ Back to Top ]
By Kathryn Hansen, NASA Earth Observatory at https://www.nasa.gov/feature/nasas-tropics-offers-multiple-views-of-intensifying-hurricanes
July 24, 2023
NASA's newest storm-watching satellites have collected their first views of hurricanes, offering scientists a new tool for understanding the inner workings of storms over shorter time spans.
Data from the TROPICS mission — short for Time-Resolved Observations of Precipitation structure and storm Intensity with a Constellation of Smallsats — will help weather researchers learn more about the environmental factors contributing to hurricane structure and intensity. Such information could prove useful for NOAA, the U.S. Joint Typhoon Warning Center, and international agencies responsible for developing hurricane, typhoon, and cyclone forecasts.
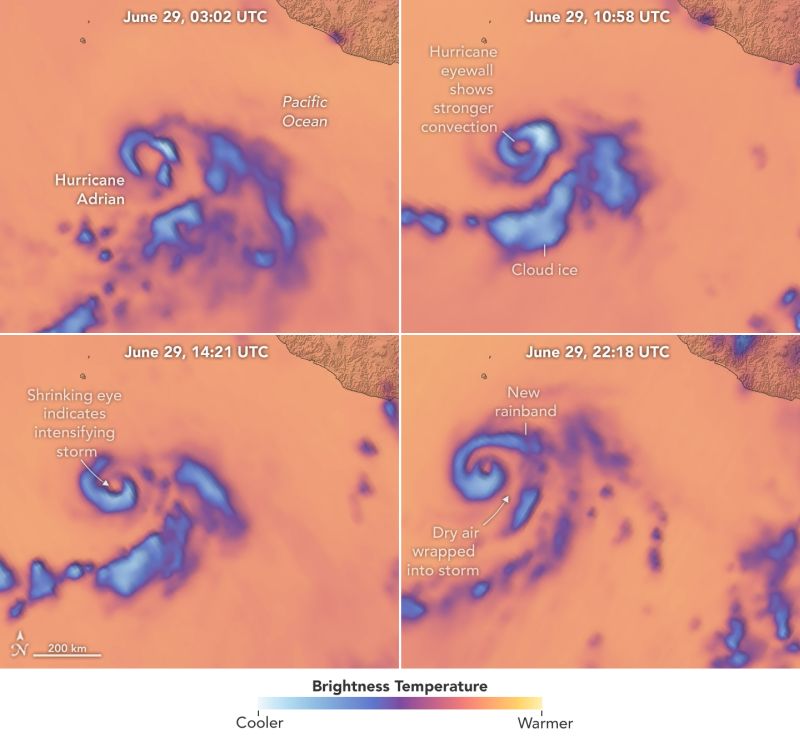
"Structural changes in brightness temperature can help tell us whether a storm is intensifying or weakening," said Patrick Duran, the mission's deputy program applications lead at NASA's Marshall Space Flight Center. These structural changes are less apparent in natural-color images, which primarily show the tops of clouds. And some features, such as the eye, often show up in microwave images before they are detected by infrared sensors on other satellites.
[ Back to Top ]
From NOAA News & Features at https://www.noaa.gov/news/record-shattering-earth-had-its-hottest-july-in-174-years
August 14, 2023

Earth just roasted under its hottest July on record, according to scientists from NOAA’s National Centers for Environmental Information (NCEI).
For the fourth-consecutive month, the global ocean surface temperature also hit a record high.
Here’s a closer look into NOAA’s latest monthly global climate report:
The average global surface temperature in July was 2.02 degrees F (1.12 degrees C) above average, ranking it as the warmest July in NOAA’s 174-year record. Because July is the globe’s warmest month of the year from a climatological perspective, July 2023 was also likely Earth’s warmest month on record.
July 2023 was the first time an average July temperature exceeded 1.8 degrees F (1.0 degree C) above the long-term average. Also of note, last month was 0.36 of a degree F (0.20 of a degree C) warmer than the previous July record from 2021. July 2023 marked the 47th-consecutive July and the 533rd-consecutive month with temperatures above the 20th-century average.
For the fourth-consecutive month, the global ocean surface temperature hit a record high as El Niño conditions that emerged in June continued into July. Globally, July 2023 set a record for the highest monthly sea surface temperature anomaly — which indicates how much warmer or cooler temperatures are from the long-term average — of any month in NOAA’s climate record, with an anomaly of 1.78 degrees F or 0.99 of a degree C. On July 13, NOAA’s Climate Prediction Center issued a statement announcing a greater than 95% chance that El Niño will continue through winter in the Northern Hemisphere.
[ Back to Top ]


By Sally Younger, NASA Jet Propulsion Laboratory at https://www.nasa.gov/feature/jpl/nasa-helps-spot-wine-grape-disease-from-skies-above-california
August 7, 2023

In a case study, scientists detected the costly infection in cabernet sauvignon grapevines before they showed symptoms visible to the human eye.
Withering molds, root-rotting bacteria, viruses, and other plant pathogens destroy an estimated 15 to 30% of global harvests every year. Early detection can make the difference between a failed crop and a treatable one. Using an airborne science instrument developed at NASA’s Jet Propulsion Laboratory in Southern California, researchers have found that they can accurately spot the stealthy signs of a grape disease that inflicts billions of dollars in annual crop damage. The remote sensing technique could aid ground-based monitoring for this and other crops.
In a pair of new studies, researchers from JPL and Cornell University focused on a viral disease called GLRaV-3 (short for grapevine leafroll-associated virus complex 3). Primarily spread by insects, GLRaV-3 reduces yields and sours developing fruit, costing the U.S. wine and grape industry some $3 billion in damage and losses annually. It typically is detected by labor-intensive vine-by-vine scouting and expensive molecular testing.
The research team wanted to see if they could help growers identify GLRaV-3 infections early and from the air by using machine learning and NASA’s next-generation Airborne Visible/InfraRed Imaging Spectrometer (AVIRIS-NG). The instrument’s optical sensor, which records the interaction of sunlight with chemical bonds, has been used to measure and monitor hazards such as wildfires, oil spills, greenhouse gases, and air pollution associated with volcanic eruptions.
It was during a 2020 campaign to map methane leaks in California that plant pathologist Dr. Katie Gold and her team seized the opportunity to pose a different question: Could AVIRIS-NG uncover undercover crop infection in one of the state’s most important grape-producing regions?
[ Back to Top ]
From NOAA News & Features at https://www.noaa.gov/news-release/us-high-tide-flooding-continues-to-break-records
August 22, 2023
Coastal communities in eight locations along the East and West coasts experienced record high tide flooding last year — a trend that is expected to continue in 2024. For many communities, the expected strengthening of El Nino will bring even more high tide flood days.
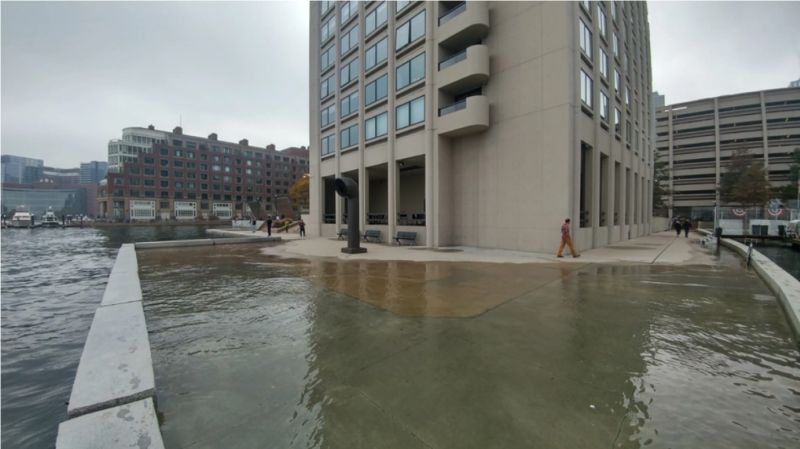
The 2023 Annual High Tide Flooding Outlook documents high tide flooding events from May 2022 to April 2023 at 98 NOAA tide gauges along the U.S. coast. It also provides a flooding outlook for these 98 locations through April 2024 and decadal projections out to 2050.
High tide flooding is becoming increasingly common due to continued sea level rise, driven in part by climate change. It occurs when tides reach anywhere between 1 to 2 feet above the daily average high tide, depending on location. As sea level rise continues, it no longer takes severe weather to cause disruptive flooding along the coast.
"Communities across the country are seeing more and more high tide flooding, with damaging effects to transportation systems and infrastructure — particularly in our most underserved communities," said Jainey Bavishi, assistant secretary for oceans and atmosphere and NOAA deputy administrator. "With sea level rise and a strong El Niño, NOAA’s forecasts are a critical resource for our nation's communities as they plan and take proactive action to build their climate resilience.”
[ Back to Top ]
From NOAA National Weather Service at https://www.weather.gov/news/232707-space-weather-prediction
July 27, 2023
NOAA’s Space Weather Prediction Center (SWPC) - a division of the National Weather Service - will upgrade one of its advanced physics-based space weather models leading to increased lead time for predicting the impact of geomagnetic storms on communications and navigation systems. The August 2 upgrade will also deliver new products for satellite operators – to help with decision-making, maneuver planning, orbit prediction, and collision avoidance – and for the aviation and communication sectors.
Geomagnetic storms, radiation storms and ionospheric disturbances can disrupt commercial aviation, ground-based users of radio wave communication, and a satellite's ability to operate and communicate. Low-Earth orbit (LEO) satellites are particularly vulnerable to variations in orbital drag, which can increase during times when the Sun is active.
The upgrade to the coupled Whole Atmosphere Model and Ionosphere Plasmasphere Electrodynamics Model (WAM-IPE Model) will now enable model predictions up to seven hours earlier by ingesting the most recent real-time solar wind data observed from NOAA’s DSCOVR spacecraft located at Lagrange point 1 between the Sun and Earth.
[ Back to Top ]
From NOAA National Environmental Satellites, Data, and Information Service at https://www.nesdis.noaa.gov/news/noaa-satellites-tracked-historic-levels-of-harmful-smoke-impacting-millions-the-eastern-us
June 20, 2023
NOAA satellites provided critical data for air quality forecasters when wildfires, burning near Quebec, Canada, sent billowing plumes of smoke over the eastern United States. The satellite data allowed NOAA scientists to estimate that more than 86 million people experienced fine particulate pollution levels higher than the federal health standard
Observations from the Advanced Baseline Imager on the GOES East satellite tracked the progression of the worst air quality, shown by the red, purple, and maroon shading in the figure below, starting in the Great Lakes on June 5 and moving to New York State and southern New England on June 6, then pushing southward into the Mid-Atlantic region on June 7–8. These historic fine particulate pollution levels were the highest recorded for many cities, including New York City, Philadelphia, and Washington, D.C.
[ Back to Top ]


From NOAA National Environmental Satellite, Data, and Information Service at https://www.nesdis.noaa.gov/news/revolutionizing-weather-forecasting-how-leo-satellites-have-changed-the-game
June 28, 2023
Weather forecasts play an essential role in the daily lives of Americans from the trivial—umbrella or sunscreen—to the critical—evacuate or find shelter. Generating more than $30 billion annually in economic benefits, weather forecasts are relied upon by nearly every sector of the U.S. economy from transportation (route planning) to utilities (pre-positioning resources ahead of a storm) to construction (keeping crews safe and projects on schedule), and much more. Americans check the weather an average of 3.8 times per day and the importance of this information is undeniable.
People often look to short-range forecasts to plan their day. Short-range forecasts provide a look into future atmospheric behavior out less than an hour to a couple of days, making them critical during high-impact weather events like hurricanes, floods, and blizzards. But the Earth’s atmosphere is a highly complex and dynamic system and predicting its future state is hard work. To tackle this challenge, the NOAA National Centers for Environmental Prediction (NCEP) runs a suite of powerful numerical weather prediction models to help meteorologists produce more reliable forecasts.
[ Back to Top ]
By Jenny Marder, et al at https://storymaps.arcgis.com/stories/90de52ccc6e04ba1b50b68e0d1057bf7 for NOAA and NASA
Some instruments launched into space spend so much time in the spotlight that their missions become household names: Hubble, Perseverance, the James Webb Space Telescope.
Others do their job quietly, delivering a steady flow of data that slips unnoticed into decisions we make every day: Simple decisions, like rain boots or sunscreen. But pressing ones too, involving sandbags and boarding up windows; finding shelter or preparing to evacuate.
Introducing the Advanced Technology Microwave Sounder, the most important scientific instrument you've never heard of. ATMS is the size of a mini fridge, and it’s hitched to the Joint Polar Satellite System’s NOAA-20 and Suomi-NPP satellites, which fly 512 miles above our heads.
You are invited to enjoy this informative and creatively presented exposé of the Advanced Technology Microwave Sounder from a superb team at NASA, NOAA, and Northrop Grumman.
[ Back to Top ]
By DC Agle, Jet Propulsion Laboratory and Alana Johnson, Karen Fox, NASA at https://www.nasa.gov/feature/jpl/nasa-s-ingenuity-mars-helicopter-flies-again-after-unscheduled-landing
August 15, 2023
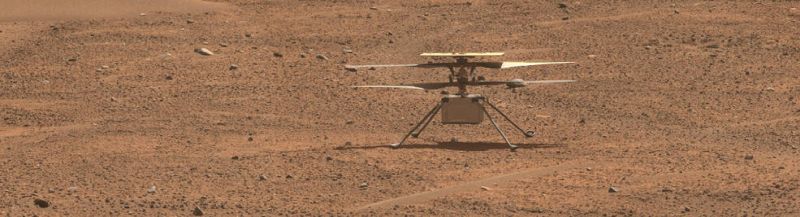
NASA’s Ingenuity Mars Helicopter successfully completed its 54th flight on Aug. 3, the first flight since the helicopter cut its July 22 flight short. The 25-second up-and-down hop provided data that could help the Ingenuity team determine why its 53rd flight ended early.
Flight 53 was planned as a 136-second scouting flight dedicated to collecting imagery of the planet’s surface for the Perseverance Mars rover science team. The complicated flight profile included flying north 666 feet (203 meters) at an altitude of 16 feet (5 meters) and a speed of 5.6 mph (2.5 meters per second), then descending vertically to 8 feet (2.5 meters), where it would hover and obtain imagery of a rocky outcrop. Ingenuity would then climb straight up to 33 feet (10 meters) to allow its hazard divert system to initiate before descending vertically to touch down.>
Instead, the helicopter executed the first half of its autonomous journey, flying north at an altitude of 16 feet (5 meters) for 466 feet (142 meters). Then a flight-contingency program was triggered, and Ingenuity automatically landed. The total flight time was 74 seconds.
"Since the very first flight we have included a program called 'LAND_NOW' that was designed to put the helicopter on the surface as soon as possible if any one of a few dozen off-nominal scenarios was encountered," said Teddy Tzanetos, team lead emeritus for Ingenuity at NASA’s Jet Propulsion Laboratory in Southern California. "During Flight 53, we encountered one of these, and the helicopter worked as planned and executed an immediate landing."
[ Back to Top ]


In addition to numerous small satellite programs such as A3Sat, both NOAA and NASA offer creative opportunities for students to engage a universe larger than themselves. Teachers and students check out some of those listed below. But, don't wait! Some have rapidly approaching closing dates. Listed in order by deadline...
[ Back to Top ]


A covert military operation examines "intel" from images obtained using satellites and cameras on unmanned airplanes. A meteorologist at the National Severe Storm Laboratory in Norman, Oklahoma, analyzes a series of satellite images and other data to predict the path and potential for destruction of a mounting tropical storm in the Atlantic Ocean. A video cameraman records a report by a television journalist at the edge of a growing forest fire that is broadcast live to homes hundreds of miles away. A radiologist uses an x-ray to "see" the broken bone in a young child’s arm. A farmer with crops randomly infected with cotton root rot studies Landsat satellite imagery to determine the very specific field areas to treat fungicide. What do they all have in common? Remote sensing – using a sensor to detect changes in reflected light at a place other than one we can directly see with our own eyes. That is a loose definition, but the concept is not. Though some remote sensing shown in motion picture stories is fiction, the evolving technology is very real and increasingly accessible. During the more than half century since the first launch of an artificial satellite, the body of knowledge about which wavelengths of the electromagnetic spectrum are most reflected by which features of the Earth’s surface and various components of the atmosphere has grown immensely.
In this lesson, learners build a simple electronic light sensor that transmits a radio signal when activated by light. The transmitted signal can be received with any FM radio and heard as an audible tone. The quality of the tone varies with the intensity of the light striking the sensor. Learners use the sensor to observe and measure the amount of light of various colors when reflected from different surfaces.
| Grade Level: | 9-12 |
| Time Requirement: | 2-3 class periods |
| Prerequisites: | Algebra 1 |
| Relevant Disciplines: | Biology, Physics, Chemistry |
[ Back to Top ]
Share your satellite-based lesson ideas with the teaching community.
Send us a full lesson plan, or simply suggest a lesson idea. If you found the idea online, please share the source as well. The lesson can be about anything that helps connect learners with satellite-based technology - any grade level K-12 - any STEM subject area or geography.
"Satellite-technology" includes any part of the science, math, engineering, or technology of satellites, rockets, and remote sensing instruments as well as the use of any environmental satellite data to explore questions related to aspects of global change and local impacts in the long term, short term, and catastrophic time frames. Of special interest are lessons providing opportunities for learners to inquire, experiment, and apply mathematics.
Perhaps you designed a lesson yourself - we will happily prepare it for future publication in More Lessons from the Sky and inclusion in the SEA Lesson Plan Library. Perhaps you found a worthy lesson plan published elsewhere - we can research it inclusion in a lesson plan spotlight. In either case, you will receive full credit for developing and/or bringing the lesson to the attention of the teaching community. Don't forget to share your insights if you tried the lesson with students.
Please share your ideas at SEA.Newsletter@SatEd.org.
[ Back to Top ]

![]()

This edition of the SEA Newsletter was produced in HTML5.
It is best viewed with most recent updates of Firefox, Edge, Chrome, Opera, or Safari.
©Satellite Educators Association, Inc. https://SatEd.org SEA.Newsletter@SatEd.org
Satellite Educators Association, Inc. is a 501(c)(3) non-profit educational organization.
In 2023, the SEA Newsletter changed from monthly to quarterly publication (March, June, September, and December). The SEA Newsletter is published on-line and available at no cost.
SEA terms, conditions, policies, and contact information are detailed HERE.
Unless otherwise listed, all photo and image credits are the authors of the articles.
Any opinons expressed in this Newsletter are those of the authors
and not necessarily those of the Satellite Educators Association, Inc.
or any of its officers, members, or representatives.
Many SEA Newsletter items contain third-party links to sites not governed by Satellite
Educators Association, Inc. The viewer is cautioned to be aware of the terms of use and
privacy policies for those third-party sites.
![]()