
OUR VISION
The world's finest educators supporting science, technology, engineering, and math (STEM) learning for pre-kindergarten to post-graduate students using real-world applications from satellites and satellite data.
OUR MISSION
To enhance the education environment to excite students about science, technology, engineering, and math through space-based technology -- satellites and satellite data.

Walter Anderson

Trust is the glue of life. It's the most essential ingredient in effective communication. It's the foundational principle that holds all relationships.
Stephen Covey

TABLE OF CONTENTS
Click a RED link to view article
ASSOCIATION NEWS
INPUT from RON
JOHN'S JOURNEY
SATELLITES with ED
ACCESS
ANALYZE
APPLY
SATELLITES
M.Y. S.P.A.C.E. News
For Teachers
More Lessons
from the Sky

March 11, 2024
In this issue, the lead story in Association News is the election of a new SEA President.
ACCESS includes a new tool for seeing what the Hubble and Webb space telescopes are currently observing; offers information about monitoring large floating mats of the macroalgae Sargassum seaweed; and gives an update on NASA's Global Precipitation Measurement mission after 10 years on station.
ANALYZE highlights the historic low in Great Lakes ice; explains how the record Amazon drought could be linked more to global warming than to El Niño; shows us coastal flooding from California storms seen by NASA's SWOT (Surface Water and Ocean Topography) mission; and describes Juno's measuring oxygen production on the Jovian moon Europa.
APPLY highlights NOAA satellite use in search and rescue around the world; advances in higher-resolution land cover data; and how coastal cities are sinking as sea level rises;>
The SATELLITES section offers an idea for seeding the stratosphere to wash it of excess carbon dioxide; highlights of the newest ozone mapping profiler suite on JPSS; describes a new, significantly upgraded addition to the ocean color monitoring mission; and offers insights into NASA's CubeSat Swarm technology.
FOR TEACHERS includes NASA's Pi Day Challenge; NOAA's Spring into Science offerings; and the new expansion of NAS JPL's Eyes on Earth web application. The M.Y. S.P.A.C.E. CAREER SPOTLIGHT is back focusing on seven women who are advancing NOAA's hurricane research and forecasting.
Ron Gird, John Moore, and Ed Murashie continue their regular column offerings and More Lessons from the Sky links to a four-lesson unit of practice on Impact Craters.
Enjoy!
--Editor

[ Back to Top ]


Simon Cracknell was elected seventh president of the Satellite Educators Association, Inc. in a duly held election, December 2023. Simon, a teacher in the United Kingdom, is the first SEA President, indeed the first SEA officer, to be elected from outside of the Untied States. He joins the Executive Committee team of Vice President Jeff Puscell, Secretary Paula Arvedson, and Treasurer Hong-li Qiu to lead the SEA into the future. Simon's election follows an unwritten practice of electing a teacher to the SEA presidency and an industry representative to the vice presidency.
Simon Cracknell is Head of Geography at Cornwallis Academy in Maidstone, Kent in the United Kingdom. He has been associated with SEA and shepherded students in the M.Y. S.P.A.C.E. Program since 2005. Simon has been a strong supporter of SEA's mission, participating in SEA meetings with voice and vote. While Simon believes SEA needs to evolve and embrace new ideas, he says, "I also believe the vision of supporting the STEM education subjects in school should be strengthened and reside at our core. The origins of SEA were classroom-based. SEA should continue to reflect that now, enhanced by new developments in the fields of satellites and remote sensing."
The Satellite Educators Association depends on a competent team of officers and supportive membership to carry out its activities. All candidates in this election are commended by SEA for their willingness to step up and run for this office. It is that kind of courage and commitment as well as the participation of all who voted that helps make an organization capable of forward motion.
Congratulations Simon, and special thanks to all candidates and voting members.
[ Back to Top ]


By Ron Gird, Meteorologist and former Satellite/Spaceflight and Outreach Program Manager for the National Weather Service
Hi Folks.
The following letter from Louisa Koch, Director or NOAA Education, introduces the NOAA Education Strategic Plan. NOAA Education reaches preschoolers through retirees both inside and outside the classroom, covering topics that span from the surface of the sun to the depths of the ocean. Each chapter in this report showcases our activities in fiscal year 2023 through short highlights, photos, and new resources connected to the goals in the NOAA Education Strategic Plan. Enjoy. -- Ron

DDear partners and friends of NOAA Education,
On behalf of the NOAA Education community, I'm pleased to present our 2023 Annual Report. This report shows the significant role that education plays in meeting NOAA's mission of science, service, and stewardship.
Here, we share dozens of highlights that demonstrate the breadth of NOAA’s work in education. These efforts show how NOAA is striving to meet the needs of learners in a changing world. In a year with record-breaking heat and many extreme weather events, our programs rose to the challenge of helping students, educators, and communities become more resilient through education. I am proud of the strong connections we have built with the people and organizations we partner with as we work to make our programs more equitable and accessible.
Each year, I'm honored to watch the young people NOAA trains as scholars, interns, and fellows accomplish great things in support of our agency. In this report, you'll find examples of just a few of the many students whose projects have contributed to NOAA’s mission. We also share examples of the opportunities we have created to let youth lead the way at NOAA and in their own schools and communities. I hope many of these talented individuals join the NOAA workforce in the years to come.
We are grateful for the dedicated support of our partners and the valuable contributions from the people we serve. Thanks to these collaborative organizations, talented students, and passionate educators, we are able to accomplish so much in support of NOAA’s mission.
Sincerely,
Louisa Koch
Director of NOAA Education
[ Back to Top ]


By John D. Moore, Executive Director, Institute for Earth Observations at Palmyra Cove, New Jersey
There will be four GLOBE Program North American Regional Meetings (NARMs) held across the USA. Each are unique in their location and focus around the USA. You can read more about each of them at www.globe.gov. On March 5-6 the Institute for Earth Observations (IEO), the New Jersey GLOBE Partner, will be hosting a regional meeting focused on Satellites and Remote Sensing. At this gathering, scientists, program managers, and educators will take a look at a wide array of established and "under-development" programs and projects funded by NASA and/or Sci-Act that are potentially related to GLOBE. For example, through IEO’s multiyear partnership with GLOBE, A3Sat project has been directly incorporated into the NASA GLOBE Mission Earth (GME) program.
The academic rationale for this meeting is really nothing new for SEA, i.e. the role and value of satellites in precollege education. The premise is that through incorporating teachings about satellites and remote sensing enhances the current GLOBE Program by expanding data collection capabilities, improving spatial coverage, providing enhanced educational opportunities, promoting interdisciplinary learning, fostering a global perspective, facilitating scientific research, and aligning with technological advancements. By integrating these concepts, the GLOBE Program moving into the future would remain at the forefront of environmental education/science and empowers students to make meaningful contributions to understanding and addressing global environmental challenges.
Educating students about satellites and remote sensing enables them to comprehend the scale and complexity of global environmental issues such as climate change, deforestation, habitat loss, and pollution. By learning how satellites monitor the Earth's systems, students gain insights into the interconnectedness of environmental processes and the importance of mitigating environmental challenges. Students may better be inspired to engage in environmental conservation.

Knowledge of satellites and remote sensing empowers students to actively engage in environmental conservation efforts. By understanding how satellite data is used to monitor changes in ecosystems, track biodiversity, and assess environmental health, students are inspired to take actions to protect natural resources and promote sustainable practices in their communities.
Career opportunities in Environmental Science are expanded through exposure to satellite technology and remote sensing techniques by introducing students to potential career paths in environmental science, geospatial analysis, and Earth observation. Incorporating satellites and remote sensing in education can help prepare a pathway forward for students by cultivating interest and proficiency in these areas making students better prepared to pursue higher education and careers focused on environmental research, monitoring, and management.
GLOBE is defined as making "observations and measurements" and using the global database for student research. It provides an avenue for data-driven decision-making. Teaching students about satellite data interpretation and analysis fosters critical thinking skills and encourages data-driven decision-making through analyzing satellite imagery and environmental datasets. Students learn how to evaluate evidence, identify patterns, and make informed judgments about environmental issues affecting their local communities and the planet as a whole.
Finally, through advancing technological literacy, satellites and remote sensing technologies represent cutting-edge tools for environmental monitoring and research. For nearly 30 years now, students have been collecting earth science data in better understanding the Earth as a System. It is time for students to understand and use data and imagery derived from satellites and remote sensors to support their research. Introducing students to these technologies enhances their technological literacy and prepares them to navigate an increasingly data-driven and technologically advanced world. This knowledge equips students with valuable skills applicable across various STEM fields and industries.
Using satellites and remote sensing in education cultivates a sense of global citizenship and environmental stewardship among students. Understanding the role of satellites in monitoring environmental changes worldwide, students develop a deeper appreciation for the interconnectedness of ecosystems and the collective responsibility to protect the planet for future generations.
The expected outcomes for the NJ GLOBE NARM are to strengthen the ties and connections to the GLOBE Satellite Education Team that was launched for the 25th Anniversary of GLOBE in 2020. As we looking forward to next year, the 30th Anniversary of GLOBE, our intent is to have well established community of leaders in the field of satellites and remote sensing that close connections with NASA, NOAA, and the National Science Foundation.
In parallel, we are working with Kevin Simmons to present these resources at the 2024 SmallSat Education Conference.
Finally, I am proud to announce that the augmented reality "HoloGLOBE" app, created at IEO and supported by friends at Merge Technologies, has reached over 1.6 million downloads worldwide!
Stay safe -- stay well!
For now, I'm John...and this is my Journey
[ Back to Top ]

Satellites with Ed begins a look at the Sun and the role environmental satellites and spacecraft from Earth play in helping us understand the Sun's behavior. In this issue, GOES Watches Over the Earth and Sun describes the Sun's structure and how that structure creates phenomena unique to stars. In the Summer issue, How Do We Know So Much About the Sun? illuminates the role of remote sensors on satellites in Earth-orbit and Earth-launched spacecraft have played in furthering our knowledge of the Sun.
Since 1975, National Oceanic and Atmospheric Administration Geostationary Operational Environmental Satellites (NOAA GOES) have imaged and made measurements of the Earth. This data is used with numerical models to forecast the weather. GOES satellites have monitored space weather since GOES-1, but GOES-16 was the first to capture solar images with its Solar Ultraviolet Imager (SUVI).
From February 25 through March 1, 2024, this author’s GOES-16 ground station received solar images which were used to create several videos at different ultraviolet wavelengths. These MP4 videos can be viewed in Dropbox or downloaded and viewed with most current media players. (See SEA's Using Satellites in Education: Accessing Data by Direct Read-Out for do-it-yourself guidelines building and operating your own, inexpensive satellite receiving station at home in the classroom.)
Let’s review what the Sun and some of its features are so we know what we are looking at.
The Sun accounts for approximately 99.8% of our solar system’s mass and has 330,000 times more mass than the Earth’s. Because gravitational force is proportional to mass, the more the mass, the greater the gravitational force. In fact the Sun has enough gravitational pull to keep not only the planets in orbit around it, but also all objects for billions of miles. At the same time this tremendous gravitational pull is trying to collapse the Sun. So why doesn't it collapse? To explain that we need to understand the structure of the Sun.
The Sun is made up of approximately 91% hydrogen, 9% helium, and trace amounts of oxygen, carbon and metals arranged in six distinct layers. Starting from the center and moving outwards, its layers are: core, radiative zone, convection zone, photosphere, chromosphere, and corona.
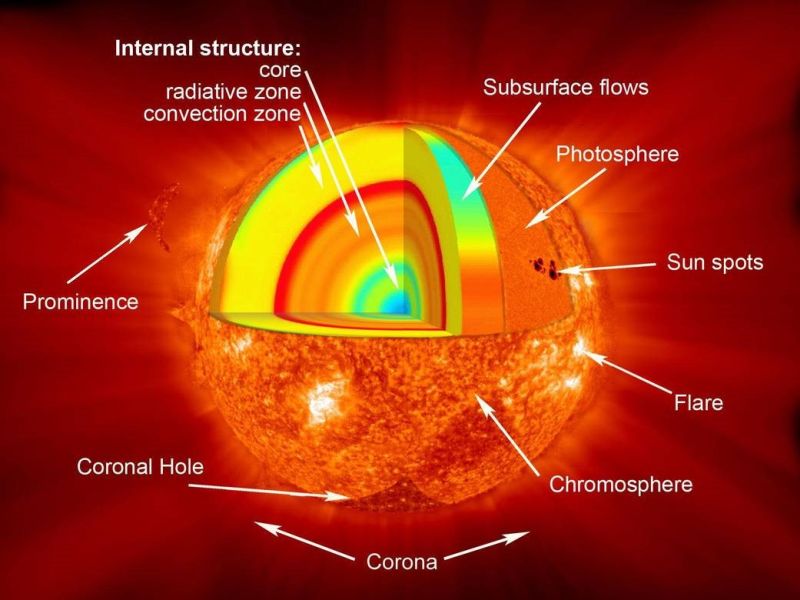
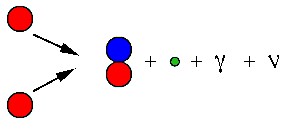
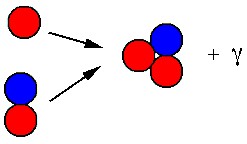
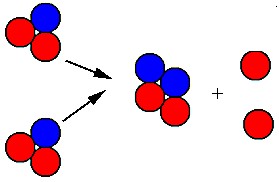
The Sun’s core is about one quarter of the Sun’s diameter and accounts for half its mass. The pressure is over 250 billion times that of our atmosphere and 15 million degrees Celsius at the center. Under those conditions, all electrons have been stripped off atoms and nuclear fusion occurs converting hydrogen into helium as shown in Figure 2. The Sun is said to convert 700 million tons of hydrogen into 695 million tons of helium every second and the remaining 5 million tons is released as energy, some of which reaches us. Energy leaving the Sun is broad spectrum covering the electromagnetic spectrum from radio waves to gamma rays. Fusion occurs in both the Sun and in an atomic bomb and it is estimated the Sun’s energy is equivalent to 400 billion megaton atomic bombs exploding every second. It is this energy that balances the Sun’s crushing gravitation force, keeping it from collapsing.
The layer next to the core is the radiative zone which lies between one quarter and three quarters of the Sun’s diameter. Its temperature ranges between the core’s outer edge of 7 million degrees Celsius where fusion has stopped and its outer edge temperature of 2 million degrees Celsius. It is less dense than the core but still dense enough to take photons between 100,000 and over a 1,000,000 years to escape in a radiative manner after bouncing off each other, sometimes being absorbed and reradiated.
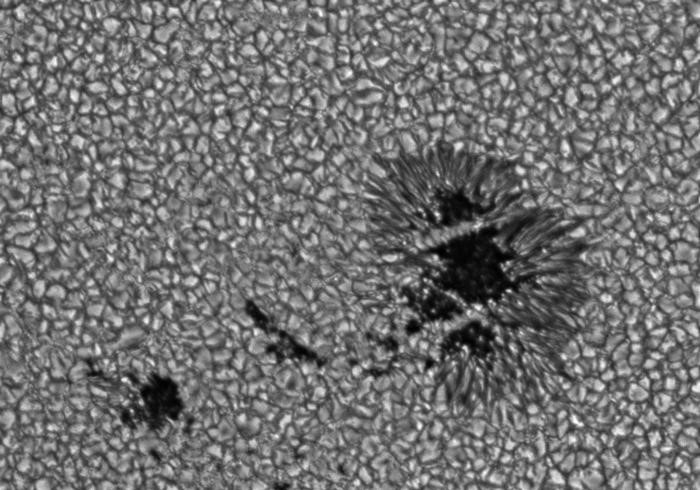
Next to the radiative zone is the convection zone which extends from the Sun’s visible surface to a depth from 200,000. It is less dense and ranges in temperature from 2 million degrees Celsius to a much cooler 5,500 degrees Celsius. Plasma currents form loops which rise, cool, and fall in a convective manner like a 1960’s lava lamp. These towering currents of plasma appear as granules on the visible surface of the sun as shown in Figure 3. Plasma is called the 4th state of matter, along with solid, liquid and gas, and is a soup of charged ions and electrons. Because of the ions and free electrons, plasma is highly conductive, and when electrical charges flow in the plasma, a magnetic field is created. These magnetic fields are key to sunspots, solar flares, and coronal mass ejections.
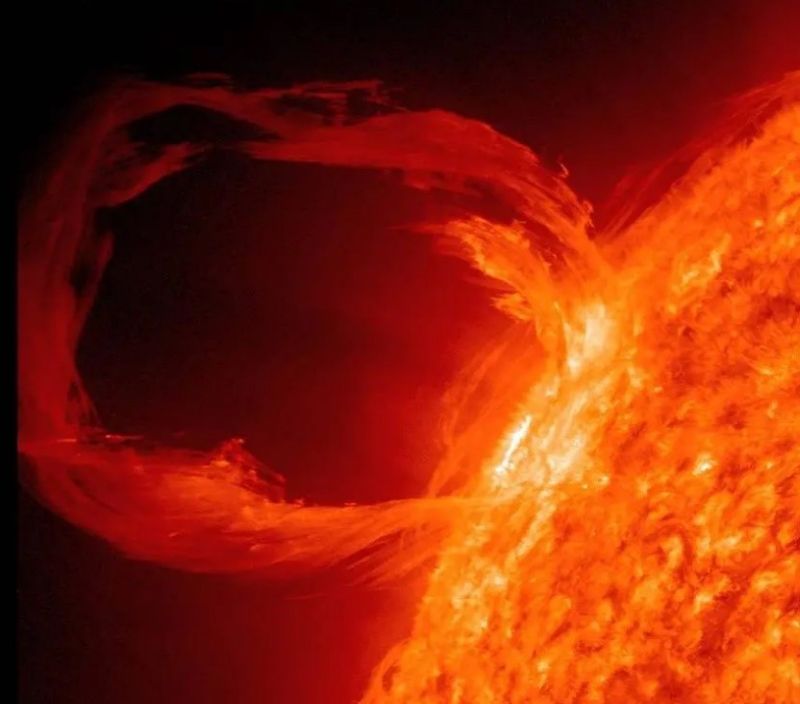
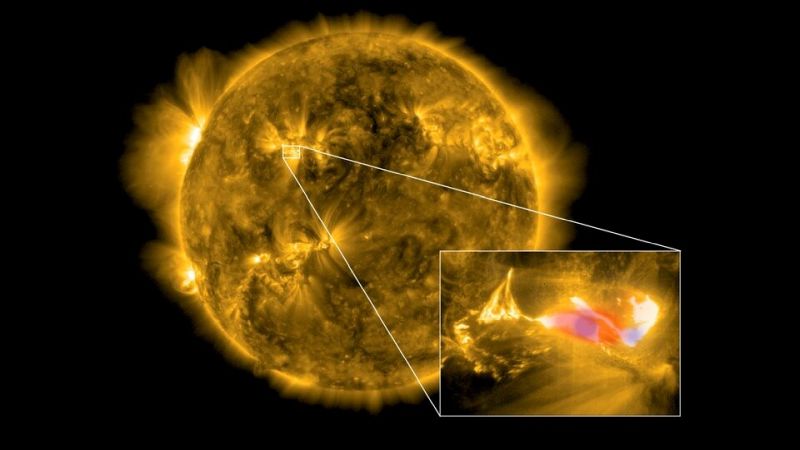
Before we get to the next layer, it is important to understand the Sun’s rotation. Unlike the solid Earth where every location is at the same location 24 hours later, the Sun being a gaseous ball has an average rotation of 27 days which varies from 24 days at the equator to 35 days near the poles. This dynamic rotation plays havoc with the plasma loops and magnetic fields in the convection zone and can even cause them to twist up like a rubber band and pass through the outer three Sun layers. We can’t directly see the magnetic fields, but because the plasma and other solar materials are captured and move with the fields, we see them as solar prominences as shown in Figure 4.
Solar flares, like the one shown in Figure 5, are giant bursts of x-rays and energy that occur when energy stored in a twisted magnetic field is released and can reach the Earth in 8 minutes. Solar flare energy intensity is rated on a scale of A, B, C, M, and X with X being the strongest. Each category is subdivided into a rating of 1-9. Like the logarithmic Richter scale, a class M flare is 10 times stronger than a C flare.
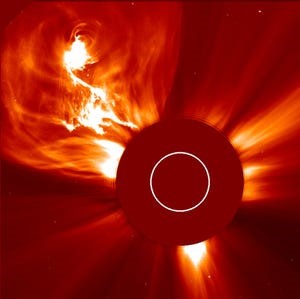
Coronal Mass Ejections (CME), like the one shown in Figure 6, are large expulsions of plasma, solar material, and magnetic fields and can reach the Earth in as little as 15 hours and as long as a few days. CMEs, or geomagnetic storms, have several different scale schemes. NOAA uses the G-Scale which goes from G1 to G5, G5 being the strongest. This idea of geomagnetic storms is part the science of space weather monitored, studied, and reported by NOAA’s Space weather Prediction Center.
Next to the convection zone is the Sun’s visible layer, the photosphere, which is responsible for most of the Sun’s visible light. It is about 100 km thick, less dense than the Earth’s atmosphere and about 5500 degrees Celsius except where the sunspots are lower at 4200 degrees Celsius. Sunspots are where the strong magnetic field passes through the photosphere and because the sunspot is cooler than the surrounding area they appear darker.
The next layer is the chromosphere and extends to about 2000 km above the photosphere. Its temperature ranges from 6000 degrees Celsius to 14,000 degrees Celsius and produces most of the Sun’s ultraviolet light.
The mysterious outermost layer of the Sun, the corona, can reach over 1 million degrees Celsius. It is mysterious because it gets hotter as you move away from the sun surface, opposite of moving your hand away from a campfire. Scientists are not 100% sure why this is the case but have some theories such as solar activity transferring heat to it. At these temperatures, the electrons are stripped away from the nucleus and create a plasma state. The Sun’s magnetic field captures some of the plasma and creates the crown effect you see during a total solar eclipse (see Figure 6).
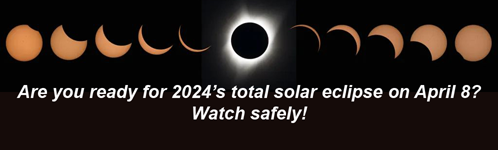
Look for Part II in the Summer SEA Newsletter where you will find an explanation of how we know so much about the Sun and some of the exciting solar events in 2024. Hint, satellites are involved!
For information about the total solar eclipse April 8, 2023, you are invited to visit https://www.ncei.noaa.gov/news/take-your-head-out-clouds-view-2024-total-solar-eclipse, and for multiple ways of viewing the eclipse safely, please see https://science.nasa.gov/eclipses/safety/.
[ Back to Top ]


From NASA Hubble Mission Team and NASA Webb Mission Team, Goddard Space Flight Center
at https://science.nasa.gov/missions/hubble/what-are-hubble-and-webb-observing-right-now-nasa-tool-has-the-answer/
March 6, 2024
It’s not hard to find out what NASA’s Hubble and James Webb space telescopes have observed in the past. Barely a week goes by without news of a cosmic discovery made possible using images, spectra, and other data captured by NASA’s prolific astronomical observatories.
But what are Hubble and Webb looking at right this minute? A shadowy pillar harboring nascent stars? A pair of colliding galaxies? The atmosphere of a distant planet? Galactic light, stretched and distorted on a 13-billion-year journey across space?
NASA’s Space Telescope Live, a web application originally developed in 2016 to deliver real-time updates on Hubble targets, now affords easy access to up-to-date information on current, past, and upcoming observations from both Hubble and Webb.
Designed and developed for NASA by the Space Telescope Science Institute in Baltimore, this exploratory tool offers the public a straightforward and engaging way to learn more about how astronomical investigations are carried out.
With its redesigned user interface and expanded functionality, users can find out not only what planet, star, nebula, galaxy, or region of deep space each telescope is observing at the moment, but also where exactly these targets are in the sky; what scientific instruments are being used to capture the images, spectra, and other data; precisely when and how long the observations are scheduled to occur; the status of the observation; who is leading the research; and most importantly, what the scientists are trying to find out.
See also Webb Unlocks Secrets of One of the Most Distant Galaxies Ever Seen at https://science.nasa.gov/missions/webb/webb-unlocks-secrets-of-one-of-the-most-distant-galaxies-ever-seen/.
[ Back to Top ]
From NOAA Nationa Environmental Satellite, Data, and Information Service
at https://www.nesdis.noaa.gov/news/orbiting-insights-transforming-sargassum-seaweed-detection-and-monitoring-space
January 10. 2024
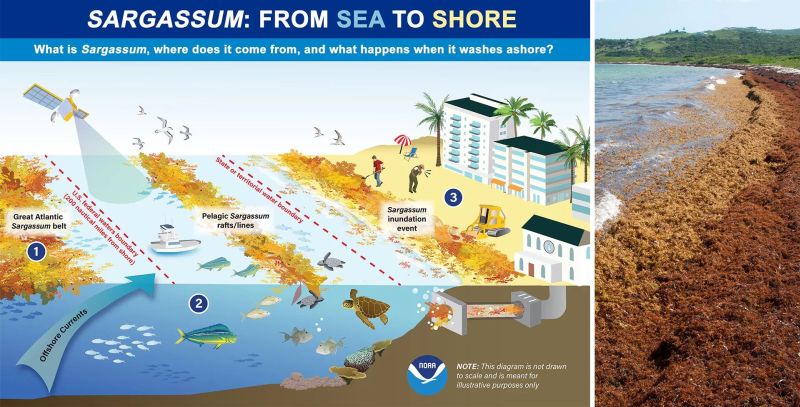
In the vastness of the open ocean, Sargassum seaweed, a floating brown macroalgae, forms large mats that serve as crucial habitats for various marine species. While providing refuge and nourishment in the sea, Sargassum becomes problematic when it reaches coastal areas in excessive amounts, leading to significant environmental, economic, and public health issues.
When Sargassum builds up along coastlines, its decomposition depletes oxygen levels, leading to dead zones that threaten marine life, including key fish species crucial for the economy. This accumulation also hinders sunlight penetration, adversely affecting vital underwater habitats such as coral reefs and seagrass beds. Tourism also suffers greatly from Sargassum inundation events, with the unsightly accumulation and foul smell of decaying seaweed on beaches driving away visitors, leading to considerable economic impacts on coastal communities. Moreover, rotting Sargassum emits hydrogen sulfide gas, posing serious health risks like respiratory problems and other ailments.
The Great Atlantic Sargassum Belt (GASB), a massive Sargassum bloom stretching from West Africa to the Gulf of Mexico, has been causing problems along the coastlines of the tropical Atlantic, Caribbean, and Gulf of Mexico nearly every year since 2011. Predicting the movement and impact of the GASB is complex due to the dynamic nature of oceanic and atmospheric factors that influence Sargassum distribution. The animation below shows the density and movement of Sargassum in the GASB as it moves across the Atlantic between March 2022 and March 2023, where lighter colors denote higher density.
[ Back to Top ]
By Christina Campen, NASA
at https://science.nasa.gov/missions/gpm/nasas-global-precipitation-measurement-mission-10-years-10-stories/
March 1, 2024
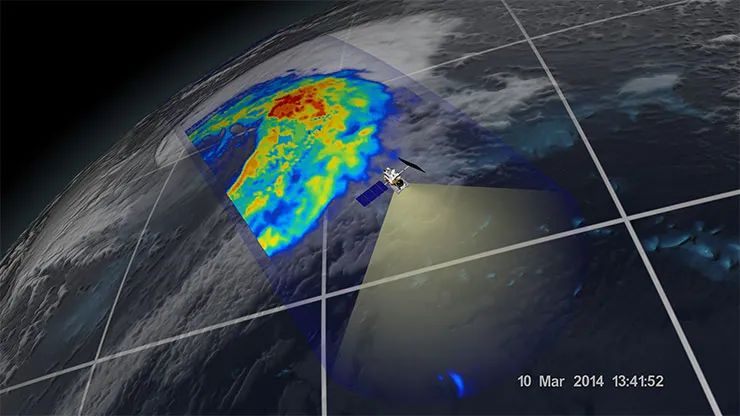
From peering into hurricanes to tracking El Niño-related floods and droughts to aiding in disaster responses, the Global Precipitation Measurement (GPM) mission has had a busy decade in orbit. As the GPM mission team at NASA and the Japan Aerospace Exploration Agency (JAXA) commemorates its Feb. 27, 2014 launch, here are 10 highlights from the one of the world's most advanced precipitation satellites.
[ Back to Top ]


From NOAA National Environmental Satellite, Data, and Information Service
at https://www.nesdis.noaa.gov/news/great-lakes-ice-reaches-historic-low
March 1, 2024
For the second consecutive year, ice cover on the Great Lakes remains significantly below average for this time of year, which typically sees the peak of ice cover at levels around 53 percent. As of February 11, total ice coverage across all lakes measured a mere 2.7 percent. Lakes Erie and Ontario are basically at — or tied with — their respective historic lows for this time of year, making both essentially ice-free. This record low ice cover is largely attributed to unusually warm temperatures throughout the region in December, paired with the generally short duration of Arctic air blasts.
The weather patterns prevailing in December play a crucial role in determining a season’s ice conditions. In recent years, numerous Decembers have exhibited above-average temperatures, with this winter notably featuring significantly warmer conditions. The delayed formation of ice due to the lack of cold air early in the season makes ice concentration harder to achieve.
Winter temperatures that are well above average have continued across much of the region surrounding the Great Lakes. Minnesota, Wisconsin, and Michigan are all experiencing their warmest meteorological winter (December through February) to date. Meanwhile, New York, Pennsylvania, and Ohio are experiencing their second, third, and fourth warmest meteorological winters.
[ Back to Top ]
By Rebecca Lindsey, Ben Clarke, NOAA Climate.gov
at https://www.climate.gov/news-features/event-tracker/preliminary-analysis-says-global-warming-more-blame-el-nino-amazons
February 7, 2024
The devastating drought in the Amazon River Basin that we wrote about in October has continued into Northern Hemisphere winter, which is the heart of the wet season in the southern part of the basin. The drought is cutting off rural and riverside communities from food supplies, markets for their crops, and health services; causing electricity blackouts due to hydropower disruptions; and forcing water rationing in some urban areas.
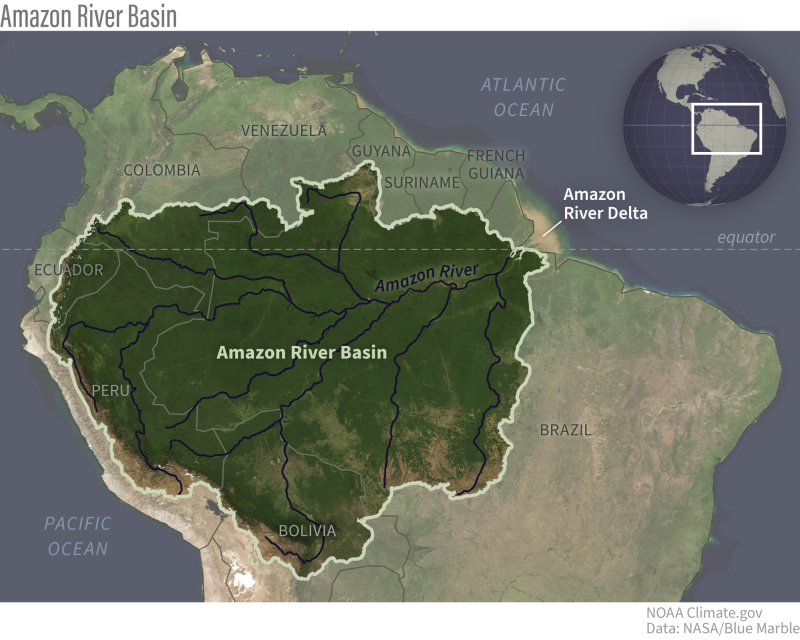
As we wrote in October, droughts are common in the Amazon during El Niño, a natural climate pattern that warms the central-eastern Pacific Ocean near the equator. Along with the ocean warming comes changes in which parts of the tropics get the most rainfall. The details vary from one El Niño to the next, but the Amazon is generally one of the rainfall losers, and the current El Niño is a strong one. In 2023, however, the rainfall shortages also came with extreme heat, which intensifies evaporation and drying of the soil.
[ Back to Top ]
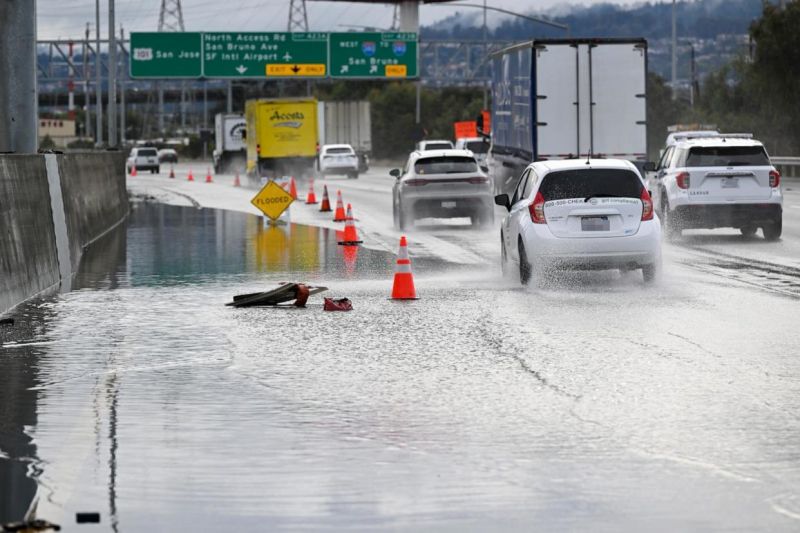
From NASA Jet Propulsion Laboratory
at https://www.nasa.gov/missions/swot/swot-satellite-catches-coastal-flooding-during-california-storms/
March 5, 2024
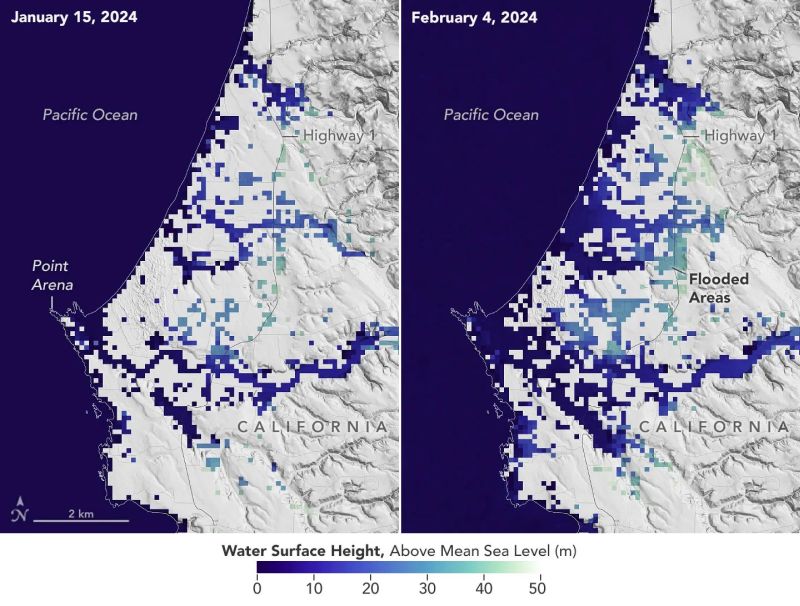
A series of atmospheric rivers drenched California in February, with record amounts of rainfall and hurricane-force winds sweeping across parts of the state. At one point, weather agencies posted flood watches for nearly the entirety of California’s coast. The Surface Water and Ocean Topography (SWOT) mission captured data on some of the flooding near the community of Manchester, roughly 105 miles (169 kilometers) north of San Francisco. The satellite is a collaboration between NASA and the French space agency, CNES (Centre National d’Études Spatiales).
The image above shows the area on Jan. 15, before the rain and snow from atmospheric rivers, and then again on Feb. 4, after the first in a series of storms soaked California. Water heights are shown in shades of green and blue, with lighter hues indicating the highest levels relative to mean sea level. (Data for inland areas includes the height of the floodwaters plus the ground elevation beneath it.) Some coastal areas were flooded by both ocean tides and heavy rain, while others were likely flooded only by precipitation. Each pixel in the image represents an area that is 330 feet by 330 feet (100 meters by 100 meters).
[ Back to Top ]
From NOAA News & Features
at https://www.noaa.gov/news/mississippi-river-hit-record-low-levels-in-october
November 8, 2023
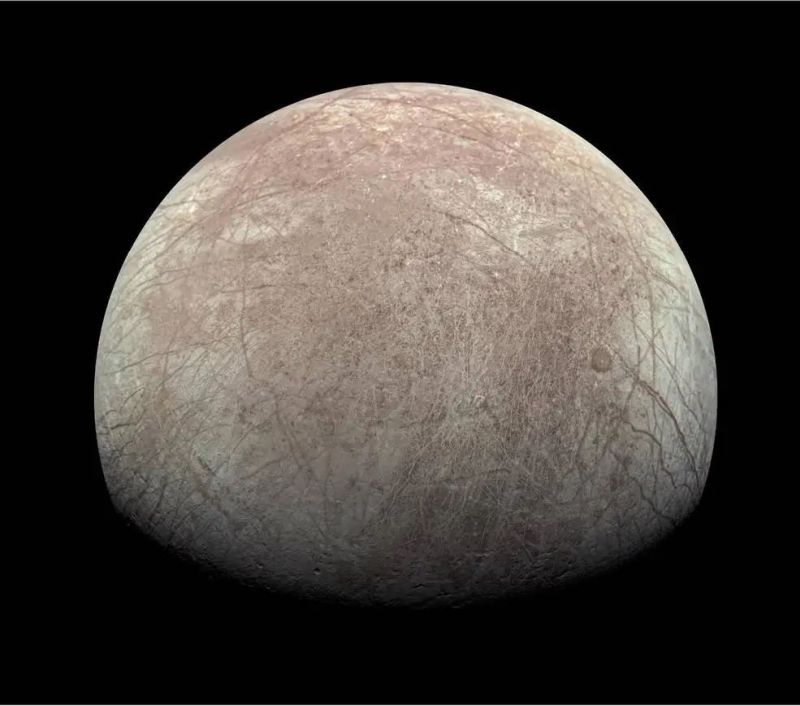
Scientists with NASA’s Juno mission to Jupiter have calculated the rate of oxygen being produced at the Jovian moon Europa to be substantially less than most previous studies. Published on March 4 in Nature Astronomy, the findings were derived by measuring hydrogen outgassing from the icy moon’s surface using data collected by the spacecraft’s Jovian Auroral Distributions Experiment (JADE) instrument.
The paper’s authors estimate the amount of oxygen produced to be around 26 pounds every second (12 kilograms per second). Previous estimates range from a few pounds to over 2,000 pounds per second (over 1,000 kilograms per second). Scientists believe that some of the oxygen produced in this manner could work its way into the moon’s subsurface ocean as a possible source of metabolic energy.
[ Back to Top ]


From NOAA News & Features
at https://www.noaa.gov/news-release/noaa-satellites-helped-save-350-lives-in-2023
January 18, 2024
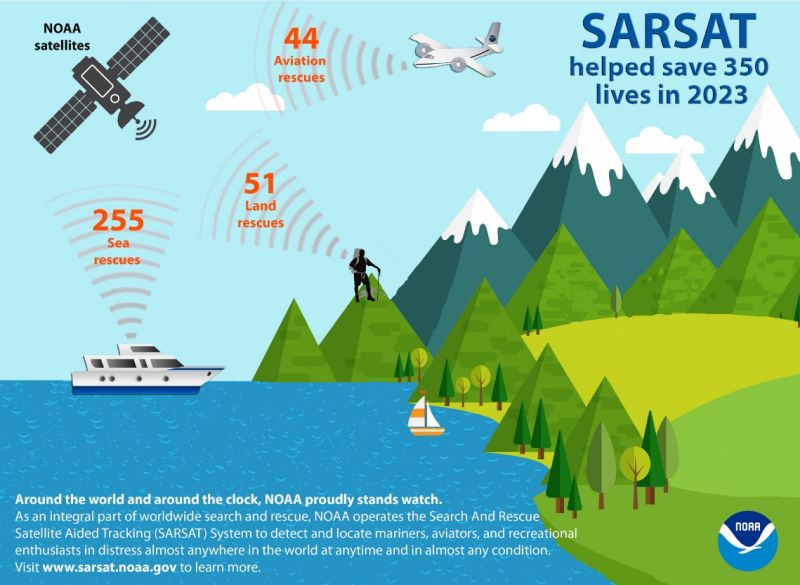
NOAA’s satellites, known for their pivotal role in tracking weather and climate, were behind the rescue of 350 people from harrowing, life-threatening ordeals in the U.S. and its surrounding waters in 2023.
NOAA’s polar-orbiting and geostationary satellites are part of the global Search and Rescue Satellite Aided Tracking system, or COSPAS-SARSAT, which uses a network of U.S. and international spacecraft to detect and locate distress signals sent from 406MHz emergency beacons onboard aircraft, boats and handheld Personal Locator Beacons (PLBs) anywhere in the world. Since its start in 1982, COSPAS-SARSAT has been credited with supporting more than 48,000 rescues worldwide, including more than 10,455 throughout the U.S. and the waters that surround it.
Of the 350 U.S. rescues last year, 255 people were pulled from the water, 44 were saved from aviation incidents and 51 were rescued on land, where PLBs were used. The record one-year total for SARSAT rescues in the U.S. stands at 421 in 2019.
[ Back to Top ]
From NOAA Office of Coastal Management
at https://coast.noaa.gov/states/stories/landcover.html
March 8, 2024
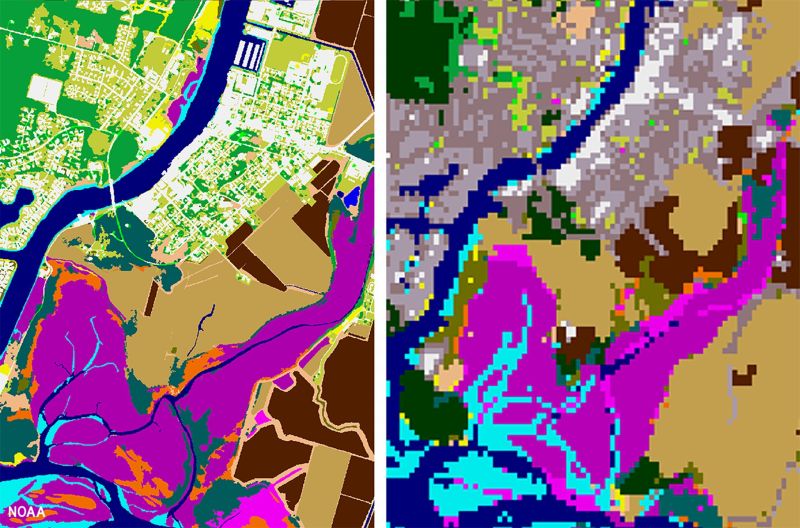
The Takeaway: High-resolution land cover data is now available through NOAA’s Digital Coast. This data provides communities with the foundational data needed to assess coastal resources, analyze land use, prepare for disaster risks, and adapt to a changing climate.
Land cover is a foundational data set that provides valuable information for a range of applications, including natural resource management, land use planning, disaster risk reduction, and climate adaptation. By comparing one year to another, people also use the information to document how the landscape has changed over time.
NOAA, in conjunction with several partners, released a high-resolution version of this data product, moving from 30-meter resolution to 1-meter. (The new data product is 900 times more detailed than the previous generation of land cover maps!) The coverage expanded, too. All of the coastal and Great Lakes states are mapped, as well as the territories, and, for the first time, Alaska.
This higher level of resolution means new data users, as the new data product can be used on a site or local level. Here are some examples.
[ Back to Top ]
By Julia Jacobo, ABC News
at https://www.aol.com/news/coastal-us-cities-sinking-sea-160149637.html
March 6, 2024
Several coastal cities around the United States are "disappearing" into the ground, according to new research, which could further exacerbate complications of sea level rise in the near future.
A considerable amount of land in 32 U.S. coastal cities could be at risk of flooding by 2050 due to subsidence, the gradual caving in or sinking of an area of land, according to a paper published Wednesday in Nature.
The continuous loss of land will affect most coastal cities, Leonard Ohenhen, a Ph.D. candidate at Virginia Tech University specializing in coastal vulnerability and large-scale land subsidence, told ABC News.
Large cities surrounded by water -- such as Boston, New Orleans and San Francisco -- will be among the regions that could experience flooding in the near future due to land elevation changes combined with sea level rise -- about 4 millimeters per year, said Ohenhen, who authored the paper.
Up to 273,000 people and 171,000 properties in coastal regions around the U.S. could be impacted, according to the paper's findings.
[ Back to Top ]


From NOAA Chemical Sciences Laboratory
at https://csl.noaa.gov/news/2024/399_0228.html
February 28, 2024
Summarizing an article by J.P. Schwartz, et al in Science Advances

Yes, but only to a small degree.
While human-caused carbon dioxide emissions are by far the most important driver of climate change, water vapor is actually the most abundant greenhouse gas, and is responsible for about half of Earth's natural greenhouse effect – the one that keeps our planet habitable.
Now, as scientists explore ways to address the impacts of climate change by removing excess heat-trapping carbon dioxide from the atmosphere and by reflecting sunshine back into space, one group of researchers has asked the question: Could removing some water vapor from the atmosphere also help mitigate climate change?
This is precisely the idea explored in a new research article published today in the journal Science Advances that authors have dubbed "intentional stratospheric dehydration" or ISD.
According to lead author Joshua Schwarz, a research physicist at NOAA's Chemical Sciences Laboratory, the ISD concept would involve dispersing small particles (known as ice nuclei) into high altitude regions of the atmosphere that are both very cold and super-saturated in water vapor. These nuclei would increase the formation of ice crystals that otherwise would not have formed.
"Pure water vapor doesn't readily form ice crystals. It helps to have a seed, a dust particle for example, for ice to form around," explained Schwarz.
If such seeds can be introduced into supersaturated air masses that are headed for the stratosphere, then some of the water vapor in that air will condense into ice and fall, thereby removing excess water vapor and dehydrating (at least partially) the stratosphere.
[ Back to Top ]
From NOAA National Environmental Satellite, Data, and Information Service
at https://www.nesdis.noaa.gov/news/unlocking-the-secrets-of-the-stratosphere-the-jpss-ozone-mapping-and-profiler-suite-omps
February 26, 2024
Stratospheric ozone is vital for protecting life on Earth, as it absorbs most of the sun’s harmful ultraviolet (UV) radiation. Located approximately 15 to 30 kilometers above the Earth, the ozone layer acts as a shield, preventing damaging UV light from reaching the surface. Depletion of this layer leads to increased UV radiation exposure, which poses significant health risks to humans and can disrupt ecosystems and food chains.
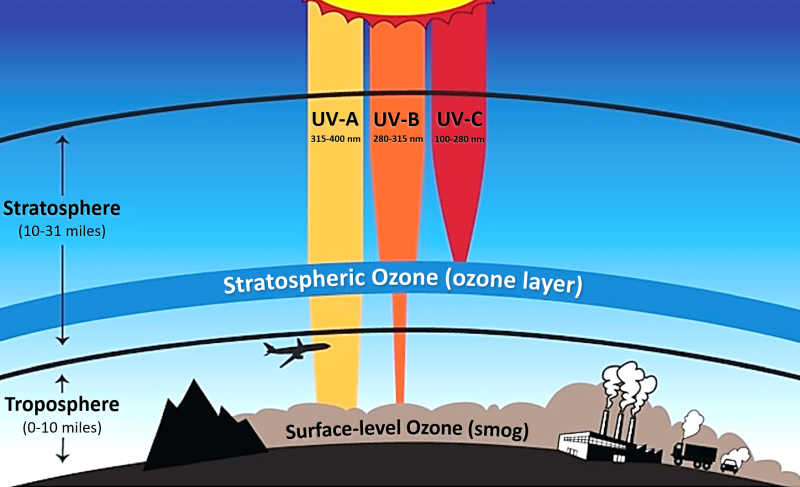
Human activities have contributed to the thinning of the ozone layer, mostly through the emission of ozone-depleting substances like chlorofluorocarbons (CFCs). These substances, once widely used in refrigerants and propellants, rise into the stratosphere where they release chlorine and bromine molecules that cause ozone molecules to break down. The discovery of the Antarctic ozone hole in the mid-1980s led to the global action of the 1987 Montreal Protocol, effectively phasing out ozone-depleting substances and paving the way for the ozone layer’s expected recovery by the mid-21st century. Still, the annual reappearance of the Antarctic ozone hole highlights the importance of continuous monitoring to ensure progress towards recovery and to inform global mitigation strategies.
Check out Analyzing the Antarctic Ozone Hole lesson plan in the SEA Lesson Plan Library.
[ Back to Top ]
By Dinah Voyles Pulver, USA Today
at https://www.aol.com/satellite-could-help-scientists-unravel-100643559.html
January 30, 2024
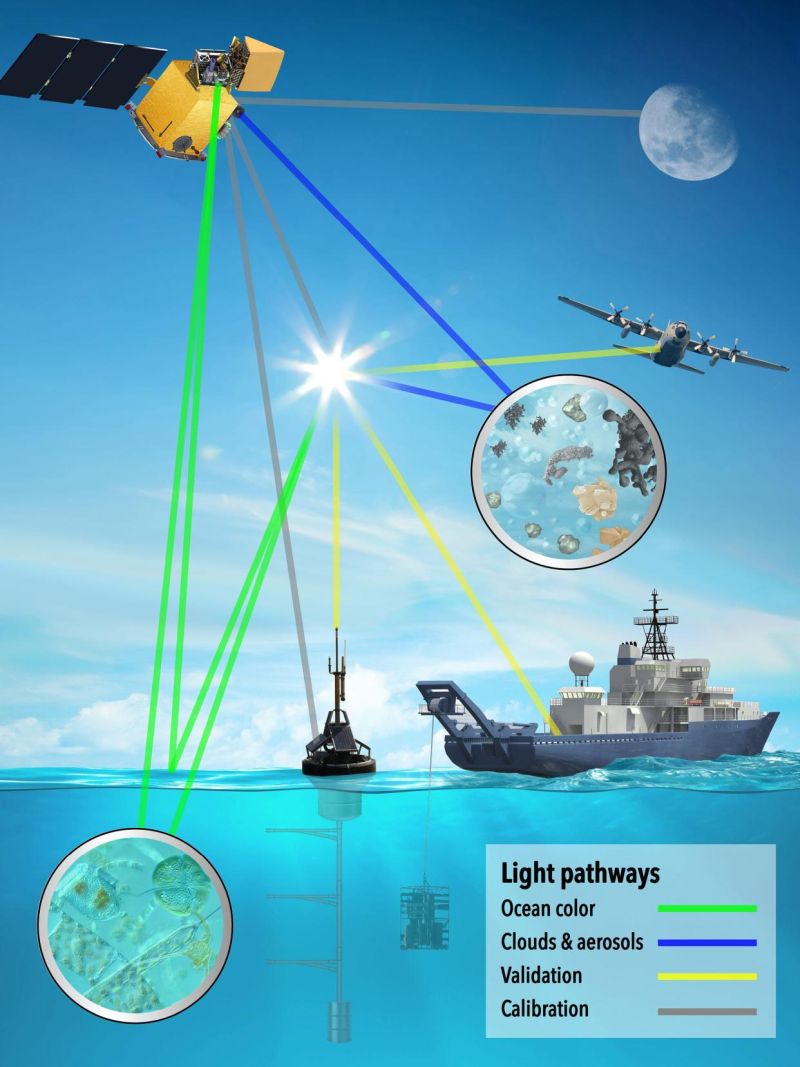
Imagine coloring a picture with 200 crayons instead of eight.
That’s the difference in light and color that a new satellite bound for orbit will bring to the study of microscopic particles in our atmosphere and waterways, said Jeremy Werdell, a project scientist with NASA.
The satellite – called the Plankton, Aerosol, Cloud and Ocean Ecosystem, or PACE – will provide crucial new information to help better understand the role such particles play in the exchange of carbon dioxide and energy in the atmosphere and ocean, and in our changing climate, scientists said.
By returning high-resolution images of light wavelengths, its equipment will provide a first-of-its-kind look at the role of phytoplankton in oceans, lakes and rivers and how aerosols absorb and scatter the sun’s energy, the scientists said.
More than a decade in the making, the satellite will relay this information in a broader array of colors than ever before, allowing scientists to identify individual species of plankton and kinds of particles.
As the expected launch date – Feb. 6 – approaches (Ed. Note: Actual launch date was Feb. 8, 2024), excitement is building not only among the project’s scientists and developers but also among scientists who will use the new information in their research. The satellite will launch from the Cape Canaveral Space Force Station aboard a SpaceX Falcon 9.
[ Back to Top ]
By Gianine Figliozzi, NASA
at https://www.nasa.gov/directorates/stmd/small-spacecraft-technology-program/nasa-to-demonstrate-miniature-cubesat-swarm-technology/
March 4, 2024
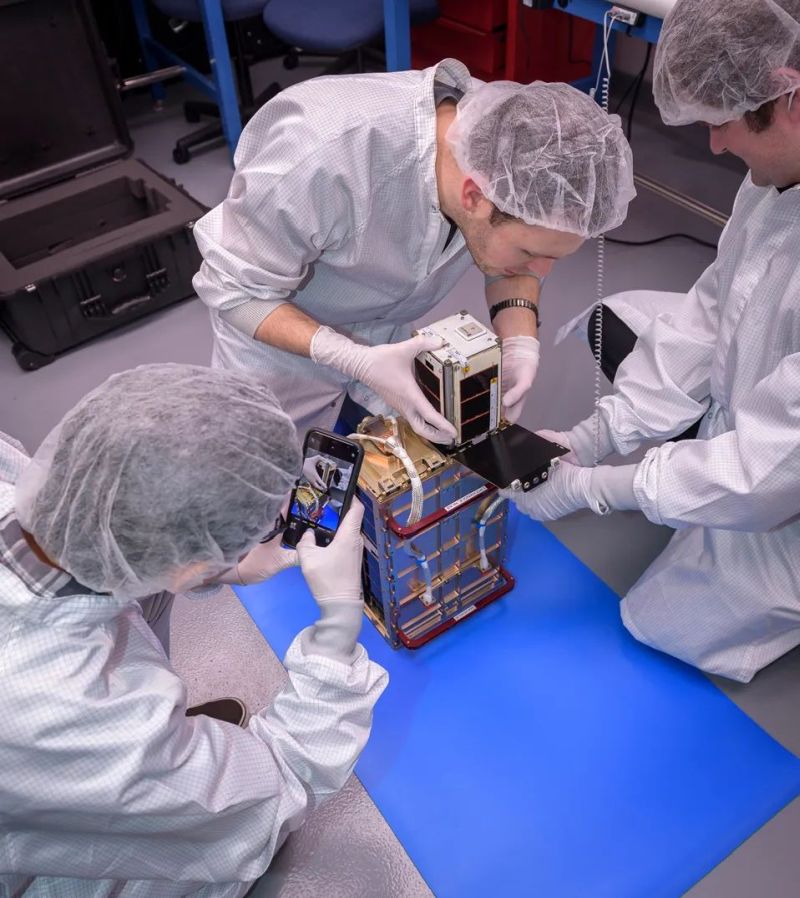
Preparations are underway for a new, small spacecraft technology demonstration that will test cost-efficient swarm capabilities – the ability for multiple spacecraft to communicate and perform coordinated actions. The PY4 mission’s four CubeSats are slated to launch Monday March 4, 2:05 p.m. PST to low Earth orbit aboard SpaceX's Transporter-10 mission from Vandenberg Space Force Base in California.
Led by Carnegie Mellon University in Pittsburgh and funded by NASA’s Small Spacecraft Technology program, PY4 seeks to demonstrate spacecraft-to-spacecraft ranging, in-orbit navigation, and coordinated simultaneous multi-point radiation measurements at low size, weight, power, and cost. It uses a unique avionics platform called PyCubed that integrates power, computing, communications, attitude determination, and orbit control functionalities into a single board system. The PyCubed system is also open-source, programmable entirely in the Python programming language and uses affordable commercial off-the-shelf components.
[ Back to Top ]


By Jesse Gwinn, NOAA Global Ocean Monitoring & Observing
at https://globalocean.noaa.gov/women-in-hurricane-science/
June 12, 2023
Hurricanes, also known as tropical cyclones, are among the most destructive natural disasters. These storms pose major risks to coastal communities and cost billions of dollars each year in damages. Impacts are expected to increase with warming ocean temperatures, rising sea levels, increasing storm intensity, and growing coastal populations. NOAA and our partners have a long history of leading hurricane research in the United States. Advancing the research helps scientists better track the location, movement, and strength of approaching storms so that we can better determine when and where a hurricane will make landfall and how severe the impacts will be. Accurate forecasts are imperative to help our communities prepare for oncoming storms, ultimately protecting life and property and mitigating the societal and economic impacts in the U.S. and associated territories.
Hurricane science is complex and dynamic, and it takes people working in a variety of roles to successfully observe and forecast storms. Oftentimes, it begins with program coordinators and managers who help to guide hurricane research by providing funding and strategic direction to advance hurricane observing technologies. Researchers use these technologies to better understand how oceanic and atmospheric conditions drive hurricane development, which is used to improve models of hurricane track and intensity. Pilots fly NOAA’s Hurricane Hunter aircrafts into hurricanes to help scientists deploy observing technologies and collect critical data that also feed into these models. This information is then used by the operational community to produce forecasts that warn the public of oncoming storms.
Although women remain a minority across STEM (science, technology, engineering, and math) fields, they make substantial contributions to hurricane sciences. With the start of the 2023 hurricane season approaching, we are highlighting some of the outstanding women working in hurricane sciences across NOAA’s programs, labs, and partners.
[ Back to Top ]


From NASA Jet Propulsion Laboratory
at https://www.nasa.gov/learning-resources/stem-engagement-at-nasa/nasa-pi-day-challenge-serves-up-a-mathematical-marvel/
March 7, 2024
Celebrate one of the world’s most famous numbers with a set of math problems involving real space missions, courtesy of the agency’s Jet Propulsion Laboratory.
March 14 marks the annual celebration of the mathematical constant pi, aka the Greek letter π. Its infinite number of digits is usually rounded to 3.14, hence the date of Pi Day. For some people, the occasion marks an annual excuse to eat pizza or pie (or both), but to truly honor this wondrously useful number, a serving of mathematics is in order, too. NASA is here to help.
Continuing a decade-long tradition, the Education Office at the agency’s Jet Propulsion Laboratory has cooked up a set of illustrated math problems involving real-life NASA science and engineering.
With the NASA Pi Day Challenge, students can use the mathematical constant to:
Answers to all four challenge questions will be available on March 15.
The NASA Pi Day Challenge is accompanied by other pi-related resources for educators, K-12 students, and parents, including lessons and teachable moments, downloadable posters, and illustrated web/mobile backgrounds. More than 40 puzzlers from previous challenges are also available.
More about the NASA Pi Day Challenge: https://go.nasa.gov/piday
[ Back to Top ]
From NOAA Education
at https://www.noaa.gov/education/spring-into-science
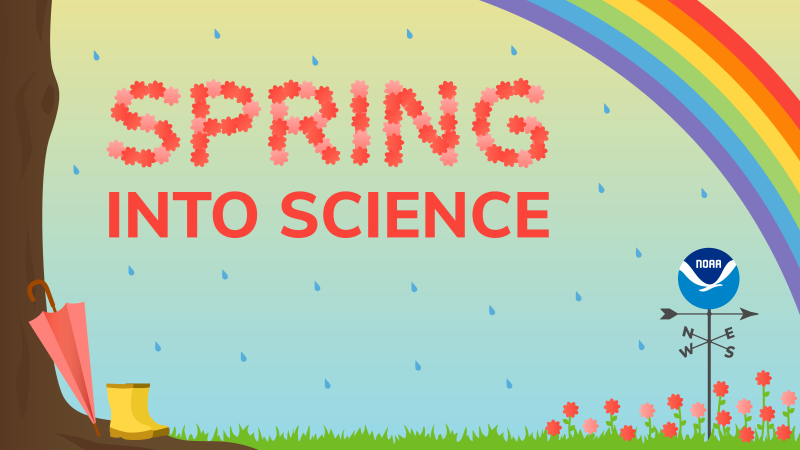
When it’s spring in the Northern Hemisphere, NOAA is here to celebrate! From news to graphics to educational resources, S-P-R-I-N-G into science with us!
Currently available offerings:
[ Back to Top ]
From NASA Jet Propulsion Laboratory, California Institute of Technology
at https://eyes.nasa.gov/
NASA's Eyes Visualization (also known as simply NASA's Eyes) is a freely available suite of computer visualization applications created by the Visualization Technology Applications and Development Team at NASA's Jet Propulsion Laboratory (JPL) to render scientifically accurate views of the planets studied by JPL missions and the spacecraft used in that study. The Eyes family of products is available for desktop computers running Windows 7+, and Mac OSX 10.8+. Deep Space Network Now and Experience Curiosity are web-based and available across all platforms. 3D models of spacecraft and other objects are displayed with the option of comparing their size to a human, school bus, or football stadium. (From https://en.wikipedia.org/wiki/NASA%27s_Eyes)
[ Back to Top ]


Two boys, aged 9 and 13, stood in one’s front yard after riding bikes during the summer of 1991 when they heard a low-pitched whistle getting louder. Then they saw a rock whistle past them and land on the ground about 4 meters away making a hole about 5 centimeters deep. They looked around but could find no evidence that anyone had thrown the rock. When they picked up the rock it felt warm. What was it? Where did it come from? Why was it warm? How fast was it going to make such a hole in the ground? How did it form? How did it get there? Were the boys in danger? So many questions and no answers yet. What should happen next? What questions do you have about the event? How might these questions be investigated?
This is a four-part unit of practice. Following Part 1, Part 2 encourages scientific inquiry and initiative in a learning center based on Russia's Tunguska Explosion Mystery of 1908. In Part 3, learners model, measure, and compare impact craters to determine size and velocity of the impacting object. Part 4 uses free online GIS to map real impact craters on Earth, plan an expedition to a potential impact site, and create and present a final report to the class. The lessons can be presented in sequence or independently.
| Grade Level: | 5-8 |
| Time Requirement: | 6-8 class periods |
| Prerequisites: | None |
| Relevant Disciplines: | Science, Math, Geography |
[ Back to Top ]
Share your satellite-based lesson ideas with the teaching community.
Send us a full lesson plan, or simply suggest a lesson idea. If you found the idea online, please share the source as well. The lesson can be about anything that helps connect learners with satellite-based technology - any grade level K-12 - any STEM subject area or geography.
"Satellite-technology" includes any part of the science, math, engineering, or technology of satellites, rockets, and remote sensing instruments as well as the use of any environmental satellite data to explore questions related to aspects of global change and local impacts in the long term, short term, and catastrophic time frames. Of special interest are lessons providing opportunities for learners to inquire, experiment, and apply mathematics.
Perhaps you designed a lesson yourself - we will happily prepare it for future publication in More Lessons from the Sky and inclusion in the SEA Lesson Plan Library. Perhaps you found a worthy lesson plan published elsewhere - we can research it inclusion in a lesson plan spotlight. In either case, you will receive full credit for developing and/or bringing the lesson to the attention of the teaching community. Don't forget to share your insights if you tried the lesson with students.
Please share your ideas at SEA.Newsletter@SatEd.org.
[ Back to Top ]

![]()

This edition of the SEA Newsletter was produced in HTML5.
It is best viewed with most recent updates of Firefox, Edge, Chrome, Opera, or Safari.
©Satellite Educators Association, Inc. (SEA) https://SatEd.org SEA.Newsletter@SatEd.org
Satellite Educators Association, Inc. is a 501(c)(3) non-profit educational organization.
The SEA Newsletter is published quarterly in March, June, September, and December.
The SEA Newsletter is published on-line and available at no cost.
SEA terms, conditions, policies, and contact information are detailed HERE.
Unless otherwise listed, all photo and image credits are the authors of the articles.
Any opinons expressed in this Newsletter are those of the authors
and not necessarily those of the Satellite Educators Association, Inc.
or any of its officers, members, or representatives.
Many SEA Newsletter items contain third-party links to sites not governed by Satellite
Educators Association, Inc. The viewer is cautioned to be aware of the terms of use and
privacy policies for those third-party sites.
![]()