
OUR VISION
The world's finest educators supporting science, technology, engineering, and math (STEM) learning for pre-kindergarten to post-graduate students using real-world applications from satellites and satellite data.
OUR MISSION
To enhance the education environment to excite students about science, technology, engineering, and math through space-based technology -- satellites and satellite data.

Walt Disney

Curiosity is the essence of human existence. 'Who are we? Where do we come from? Where are we going?...I don't know. I don't have any answers to those questions. I don't know what's over there around the corner. But I want to find out.
Gene Cernan

TABLE OF CONTENTS
Click a RED link to view article
Association News
Input from Ron
John's Journey
Satellites with Ed
News from USGS
News from NOAA
News from NASA
In the News
More Lessons
from the Sky
Go to SEA Home Page

Satellites & Education Conference XXXV "Earth Speaks - We Listen!" is happening on July 29-30, 2022, live and in-person. The conference will also be on ZOOM for those unable to travel to Los Angeles. Online access is now open for...
New this year...The conference will be hosted live and in-person at Charter College of Education at California State University, Los Angeles, for the first time since 2019. The conference will also be hosted on ZOOM for those attendees, presenters, and exhibitors who cannot join us in person.
Although this hybrid-format is not without its challenges, the Executive Committee and Conference Planners are hard at work preparing a dynamite conference experience for all. This year's special focus: the James Webb Space Telescope. The conference agenda and schedule will be published as soon as it is finalized.
The goal of the Satellites & Education Conference is raising the level of awareness, in teachers and students grades K-12 and beyond, of the availability and use of satellite-based remote-sensing data and related engineering and technology opportunities and thereby fostering informed stewardship of our planet, its resources and inhabitants. For more than three decades, the annual Satellites & Education Conference has brought teachers and students together with resource-rich representatives of academia, the aerospace industry, and government - especially NOAA, NASA, USGS - providing knowledge and tools to address the challenges of 21st century STEM education.
This outstanding event for teachers has been offered each and every year since 1988. From 1988-2001, the conference was held at West Chester University in Pennsylvania. The conference has been hosted by Cal State LA since 2002.
Teachers attending the Satellites & Education Conference continuously report this is the best conference they ever attended. It is rare to find such a rich community of scientists and engineers from aerospace, NOAA, NASA, USGS, and university researchers interfacing so supportively with educators!
Don't miss the event of the summer celebrating 35 years of service and community in support of STEM education and an awareness of ever-changing global climate. Register at https://SatEd.org/conferences/ today!
(And did we mention Active Members of the Satellite Educators Association automatically receive more than 20% discount off conference registration? Not a member yet? Or has your membership lapsed? No problem. Just include membership with your conference registration to receive the discount.)

[ Back to Top ]
Start planning now! Satellites & Education Conference XXXV, July 29-30, 2022, needs presenters and exhibitors for both the face-to-face conference at Cal State LA and on ZOOM!
Presenters can submit presentation proposals and exhibitors can request exhibit space -- all online.
Of particular interest are presentations and exhibits about or that include the James Webb Space Telescope.
Some may be asking how it is possible to exhibit on ZOOM for an in-person conference. There are pros and cons for both modes of presentation and exhibit. Check out the detailed information about benefits for presenters and exhibitors, co-presenters, co-exhibitors, facilities, handout distribution, and more at the links above. It's all available on-line now.
Below you will find links to the Conference Highlights pages of the last five Satellites & Education Conferences -- three were in-person (pre-COVID) and two were completely on-line. Peruse the pages and their downloadable Conference Programs at your convenience to get an idea of the type and quality of the presentations and exhibits that happen at Satellites & Education Conferences. Then consider how best to share your information.
Thank you in advance for supporting "Satellites & Education."
[ Back to Top ]

The Vic Everett Memorial Service Award is given to SEA members of good character who have demonstrated excellence in service to the Satellite Educators Association and others by helping promote the vision and mission of the organization inside and outside of SEA events and assisting in preparation and delivery of SEA programs.
Active SEA members can nominate deserving individuals online. The nominations are reviewed by the Selection Committee and the final decision is by the Executive Committee.
The award recipient is honored during the annual Satellites & Education Conference.
More information about Vic Everett and the Service Award can be found HERE and HERE.
To nominate a member for the Serevice Award, visit https://SatEd.org and select Member Log In. Follow the prompts Member Services and select Nominate for the Vic Everett Memorial Service Award.
[ Back to Top ]
Announcing the Annual Meeting fo the Satellite Educators Association on Thursday, July 28, 2022 at noon (PDT) on ZOOM.
Although the Executive Committee of the Satellite Educators Association held several meetings for members throughout this past year to receive members' input planning the 2022 conference, the By-Laws of the Satellite Educators Association, Inc. require an "Annual Meeting," the time and place to be determined by the Executive Committee but usually concurrent with the annual Satellites & Education Conference.
While the meeting is open to all, only currently "Active" members (those with dues paid at least through July 31, 2022) have voice and vote at the meeting. Other speakers may be recognized at the discretion of the meeting's presiding officer. For the sake of security, however, the ZOOM link and log-on code will be emailed only to Active members during the week before the meeting.
To check your membership status, visit https://SatEd.org, click Join Us, and select Check. Type in your first and last names and your email address. Be sure to use the form of your name and email that you previously used with SEA. Your membership status will be displayed.
New members may join and lapsed members may renew ay visiting https://SatEd.org, clicking Join Us, and selecting Continue. Membership is still only $20 per year. And, don't forget, Active members automatically receive more than 20% discount off conference registration.
[ Back to Top ]
Still undecided about signing up for Satellites & Education Conference XXXV? Want to know what you are signing up for?
Watch https://SatEd.org/conferences/ for latest details about speakers, presenters, and exhibitors when the conference program is announced.
Take a look at these Conference Highlights pages and their downloadable Conference Programs from the last five years -- three from in-person conferences (pre-COVID) and the last two were on-line only. Each conference was extraordinary in its own way. Perusing the programs may give you as sense of the type and quality of happenings at Satellites and Education Conferences.
Then visit SEA's Conference home page to join us in person or on ZOOM for the 35th annual Satellites & Education Conference!
[ Back to Top ]


By Ron Gird, Meteorologist and former Satellite/Spaceflight and Outreach Program Manager for the National Weather Service
Neal deGrasse Tyson gave this interview on Motivation Hub, posted on YouTube. In it, he speaks so plainly and logically about curiosity -- most thought provoking. I commend it to everyone's viewing. Enjoy.
[ Back to Top ]


By John D. Moore, Executive Director, Institute for Earth Obervations at Palmyra Cove, New Jersey
As we approach the Satellites & Education Conference XXXV, it is a great time to look back in my (our) Journey to acknowledge the work and positive impact we have had on teachers and students literally around the world. What has always made the Satellite Educators Association (SEA) and the Conference unique, is the gathering of education, government, and industry in one place to present and discuss new ideas, resources, and most importantly, technology. As all three have evolved, SEA has kept pace. With such considerable accomplishments in the world in general and SEA in particular, and with constant educational support from NASA and NOAA over the years, one must wonder how it is that satellite and remote sensing are not the subject of real discussions and investigations in classrooms across the USA today.
In 2022 the role of satellites in our everyday life -- weather, GPS, communications -- is clear. Less obvious is the array of Earth Observing Satellites that play crucial roles in our developing understanding of major issues such as climate, water, agriculture, landcover, sustainability, and change. Industries have been created and are flourishing, yet Space Studies are virtually non-existent in schools. There are some exceptions; ten schools are working with me on the A3Sat Project which focuses on CubeSats. Other programs are emerging focused on the broader, more general topic “SmallSats.”
Educational Policy has flirted with such concepts such as Project Based Learning, using real time data, data literacy, the use of big data, engineering, coding, computer science, and even “STEM” applied in standard and college preparatory science instruction. These initiatives seem to come and go. It is unfortunate that many are not sustained and often lead to little or no improvement in student achievement over time according to national achievement statistics. In contrast, Career Technical Education (CTE) is a system where students have a voice in the selection of their studies. I have witnessed higher than usual student achievement when students have the option of providing input in their learning…it allows their passion to flourish. Perhaps CTE could be a model for other curricular areas.
Entire new private space agencies have emerged such as SpaceX, Blue Horizon, and others. The International Space Station has expanded and those aboard are continually is doing science in Zero-G conditions where new discoveries are made. But have you ever had a student ask you how to get that job? If, like me, you have, then you understand the difficulty in helping that student follow the question with course choices to remain focused on that goal and carry that passion into college/university community. The K-12 path is not always clear.
But why are we waiting? While the science community has recently shifted its focus from STEM to enhancing diversity, one must ask the question, “Why are we surprised at the diversity statistics?” If students are not even exposed to the industry and its possibilities for career opportunities, how can they be expected to prepare and enter that workforce?
I call on NASA, NOAA, SpaceX, Blue Horizon, and the other current and emerging space enterprise systems to lead and support those topics of instruction and opportunities for students to become actively focused on satellites and remote sensing; help guide young minds to productive and satisfying careers that also support our national economy and security. Funding helps. Education, government, and industry have supported programs like First Robotics; other agencies have spent millions of dollars to broaden participation, create diversity, and provide opportunities to underrepresented groups. Yes, funding helps, but it is leadership that is required.
Many have worked long and hard throughout the six and a half decades since the launch of the first artificial satellite. Yet the challenge remains. Today, the stakes are even higher, not just for the U.S., but for the entire world. Let’s push for “Satellite Literacy” for our next generation of STEM professionals!
Once again, don’t forget to register for this year’s Satellites & Education Conference. Register online and share your ideas with a session presentation and/or exhibit. I am looking forward to seeing all of you there.
Remember - “you can teach anything with satellites”.
Stay safe - stay well!
For now, I'm John...and this is my journey.
[ Back to Top ]

By Edward Murashie, President, Proengineered Solutions
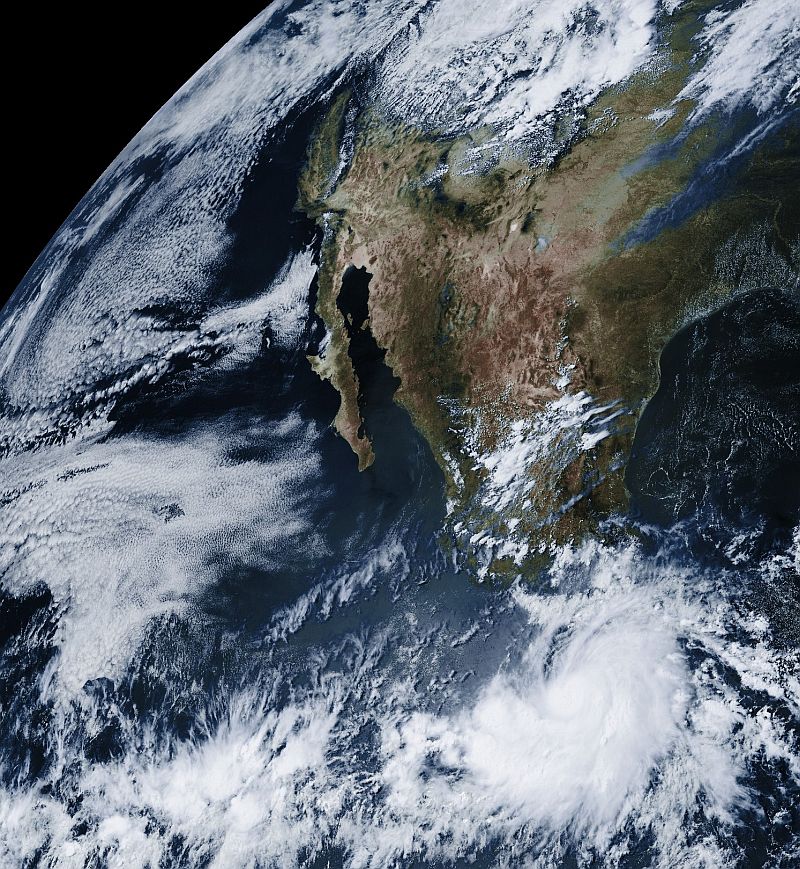
Hurricane Agatha was the first hurricane of this Eastern Pacific season which runs from May 15 through November 30. It made landfall west of Puerto Angel, Mexico as a Category 2 on May 30 around 4pm CDT. At a sustained peak wind speed of 110MPH, it was the strongest hurricane ever in the month of May. For comparison, the last May hurricane was Hurricane Barbara in 2013 with only 70MPH winds1.
So if this is the strongest hurricane in May, what is in store for the rest of the Eastern Pacific, Central Pacific, and Atlantic hurricane seasons?
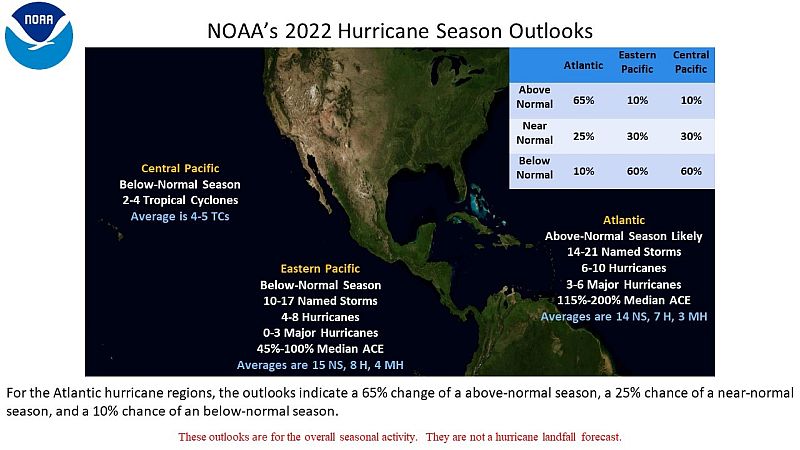
For the Eastern Pacific it looks pretty good with a below-normal season prediction. For the Atlantic, not so good with an above-normal prediction. Some staggering statistics3 for the Atlantic season, which runs from June 1 through November 30, are:
Trying to balance bad news with good, here are some stats:
Data that goes into the weather prediction model comes from weather observations, weather balloons, ocean buoys and the polar NOAA and geostationary GOES satellites. Some of the GOES data capabilities include measuring cloud top cooling, profiling the atmosphere including upper level wind speeds, and measuring the ocean surface temperature4. The GOES satellites are also a great tool for tracking hurricanes by their very nature of being geostationary and with their visual and infrared day/night capability.
The GOES satelite image above was taken from my home GOES-16 ground station and shows Hurricane Agatha just after it reached Category 2 status. An HRIT station can easily be assembled for classroom or home use -- learn more at this year’s conference and on the Satellite Educators Association web site5. Until you build your classroom GOES ground station, you can learn about and track hurricanes at the National Weather Service’s National Hurricane Center6.
As always if you have any questions please feel free to contact me at eamurashie at gmail dot com.
[ Back to Top ]

By Jessica Fitzpatrick, Public Affairs Specialist, USGS
May 2, 2022
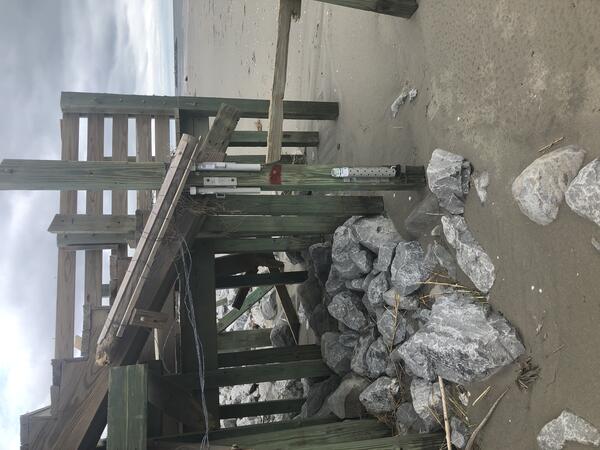
Scientists with the U.S. Geological Survey are dedicated to making sure the best knowledge on coastal storms is available to the people who need it. The USGS works with many partners to monitor waves and storm surge, forecast changes to the coast, measure flooding, create detailed maps of at-risk areas, monitor water levels and flow in rivers and streams, assess the potential spread of non-native species and provide an array of other resources and tools for situational awareness.
Take this short quiz—just seven questions—to see how much you know about hurricane science.
1. What was the highest wave height documented by a USGS storm tide sensor in 2021 from a hurricane along the Atlantic or Gulf coasts?
a) 5.81 feet
b) 10.33 feet
c) 13.48 feet
Scroll down below the image to see the answer.
Answer: The correct answer is c) 13.48 feet. The wave was recorded by a USGS storm tide sensor in Grand Isle, Louisiana, during Hurricane Ida on August 29, 2021. Prior to a hurricane making landfall, USGS field crews may install storm tide sensors along a storm’s projected path. Those sensors record the height, extent and timing of storm surge. They are installed on bridges, piers and other structures that have a good chance of surviving the storm. The USGS also has hundreds of pre-installed brackets in select locations that may be used to quickly install sensors. Learn more by reading about USGS storm tide monitoring. While there may have been higher wave heights not captured by USGS storm tide sensors, this example shows the power of hurricanes and the importance of science to help identify communities at risk.
2. What does the USGS use to create 3D elevation maps of the U.S.?
a) Pulses of light
b) Pulses of sound
Scroll down below the image to see the answer.
[ Back to Top ]


From NOAA NESDIS News & Events
May 11, 2022
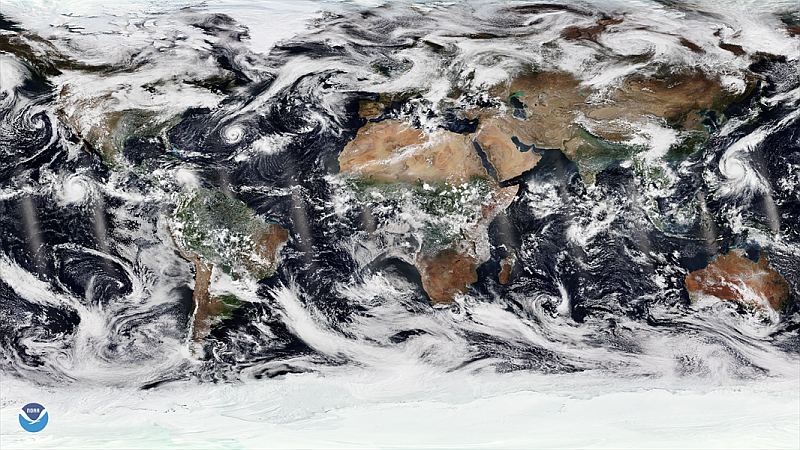
On May 11, 2022, NOAA shared the first images of the Western Hemisphere from its GOES-18 satellite. The satellite’s Advanced Baseline Imager (ABI) instrument recently captured stunning views of Earth.
GOES-18, NOAA’s newest geostationary satellite, launched on March 1. The ABI views Earth with sixteen different channels, each measuring energy at different wavelengths along the electromagnetic spectrum to obtain information about Earth’s atmosphere, land, and ocean.
[ Back to Top ]
From NOAA NESDIS News & Events
May 20, 2022
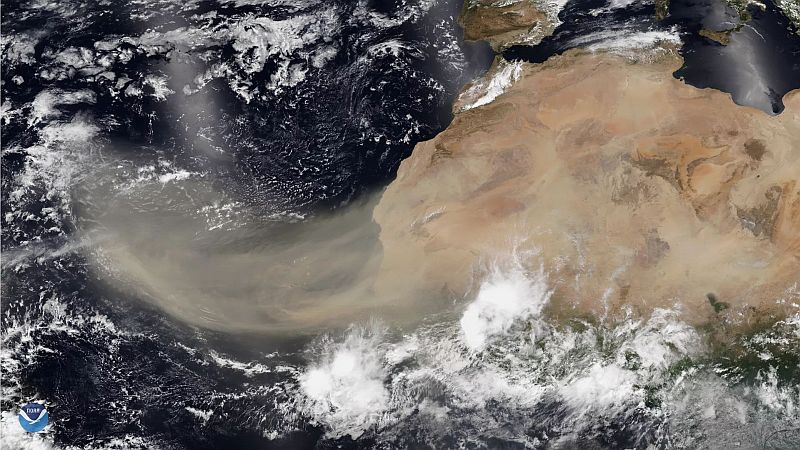
As we approach the 2022 Atlantic Hurricane Season, you will no doubt hear a lot about the Saharan Air Layer—a mass of very dry, dusty air that forms over the Sahara Desert during the late spring, summer and early fall.
This layer can travel and impact locations thousands of miles away from its African origins, which is one reason why NOAA uses the lofty perspective of its satellites to track it.
We sat down with scientist Dr. Jason Dunion, a University of Miami hurricane researcher working with NOAA's Atlantic Oceanographic and Meteorological Laboratory, to ask him a few questions about the Saharan Air Layer.
NESDIS: What causes the Saharan Air Layer (SAL) to form?
Jason: SAL outbreaks can form when ripples in the lower-to-middle atmosphere, called tropical waves, track along the southern edge of the Sahara Desert and loft vast amounts of dust into the atmosphere. As the SAL crosses the Atlantic, it usually occupies a 2 to 2.5-mile-thick layer of the atmosphere with its base starting about 1 mile above the surface. The warmth, dryness and strong winds associated with the SAL have been shown to suppress tropical cyclone formation and intensification.
NESDIS: Is it common for dust from the Sahara to cross the Atlantic on a regular basis?
[ Back to Top ]
From NOAA Research News
May 11, 2022
A new NOAA study published today in the journal Science Advances about four decades of tropical cyclones reveals the surprising result that reducing particulate air pollution in Europe and North America has contributed to an increase in the number of tropical cyclones in the North Atlantic basin and a decrease in the number of these storms in the Southern Hemisphere. The study also found that the growth of particulate pollution in Asia has contributed to fewer tropical cyclones in the western North Pacific basin.
“Air pollution is a big environmental risk to human health and we have made great strides in reducing health risks by reducing particulate air pollution,” said Hiroyuki Murakami, a physical scientist at NOAA’s Geophysical Fluid Dynamics Laboratory and study author. “But reducing air pollution does not always decrease the risk of hazards from tropical cyclones.”
While a number of recent studies have examined how increasing greenhouse gas emissions are impacting global tropical cyclone activity, Murakami tackles the less studied and highly complex area of how particulate pollution in combination with climate changes is affecting tropical cyclones in different areas of the planet. Murakami reaches these conclusions using the state-of-the-art climate model developed at NOAA GFDL.
Over the last 40 years, Europe and North America have been leaders in reducing particulate air pollution from industry, autos, energy and other sources. The increasing absence of human-caused air pollution in the Northern Hemisphere, estimated to be a 50-percent drop in concentration from 1980 to 2020, has led to surface warming over the tropical Atlantic Ocean, which contributes to more frequent tropical cyclones. Without significant amounts of particulate pollution to reflect sunlight, the ocean absorbs more heat and warms faster. A warming Atlantic Ocean has been a key ingredient to a 33-percent increase in the number of tropical cyclones during this 40-year period, Murakami said.
[ Back to Top ]
From NOAA News & Features
May 9, 2022
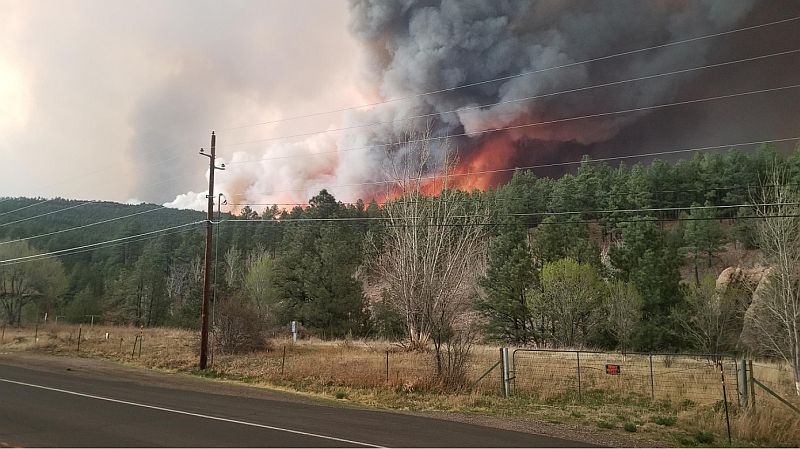
April 2022 was slightly cooler and wetter than normal across the contiguous U.S., according to the National Centers for Environmental Information.
What made the month standout was an early start to the wildfire season, several tornado outbreaks and a widespread Western drought.
Below are more takeaways from NOAA’s latest monthly U.S. climate report:
The average April temperature across the contiguous U.S. was 50.7 degrees F (0.4 of a degree below the 20th-century average), ranking in the middle third of the 128-year record.
Temperatures from the Northwest to the Great Lakes and into the mid-Mississippi Valley were generally below average, while much of the Southwest, Deep South and portions of the East Coast saw above-average temperatures.
The average precipitation for the month was 2.58 inches — 0.06 of an inch above average — which places the month in the middle third of the historical record.
Above-average precipitation fell across portions of the Northwest, northern Rockies and Plains, Great Lakes and Northeast, while the Southwest and the central and southern Plains saw below-normal precipitation.
The average U.S. temperature for the year to date (YTD, January through April 2022) was 39.9 degrees F (0.8 of a degree above average), ranking in the warmest third of the climate record. Temperatures were above average across parts of the West and also along the East Coast, with California seeing its sixth-warmest such YTD on record.
The average precipitation for the first four months of 2022 was 8.25 inches (1.22 inches below normal), which ranked as the 13th-driest January-through-April YTD on record. California had its driest YTD on record for this four-month period, while Nevada and Utah had their third driest.
[ Back to Top ]


Edited by Margaret W. Carruthers, Space Telescope Science Institute
May 27, 2022
With its mirror segments beautifully aligned and its scientific instruments undergoing calibration, NASA’s James Webb Space Telescope is just weeks away from full operation. Soon after the first observations are revealed this summer, Webb’s in-depth science will begin.
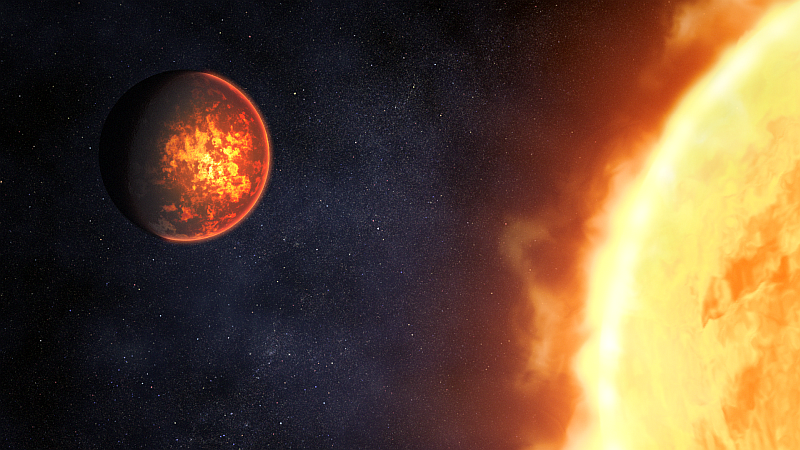
Among the investigations planned for the first year are studies of two hot exoplanets classified as “super-Earths” for their size and rocky composition: the lava-covered 55 Cancri e and the airless LHS 3844 b. Researchers will train Webb’s high-precision spectrographs on these planets with a view to understanding the geologic diversity of planets across the galaxy, and the evolution of rocky planets like Earth.
55 Cancri e orbits less than 1.5 million miles from its Sun-like star (one twenty-fifth of the distance between Mercury and the Sun), completing one circuit in less than 18 hours. With surface temperatures far above the melting point of typical rock-forming minerals, the day side of the planet is thought to be covered in oceans of lava.
Planets that orbit this close to their star are assumed to be tidally locked, with one side facing the star at all times. As a result, the hottest spot on the planet should be the one that faces the star most directly, and the amount of heat coming from the day side should not change much over time.
But this doesn’t seem to be the case. Observations of 55 Cancri e from NASA’s Spitzer Space Telescope suggest that the hottest region is offset from the part that faces the star most directly, while the total amount of heat detected from the day side does vary.
One explanation for these observations is that the planet has a dynamic atmosphere that moves heat around. “55 Cancri e could have a thick atmosphere dominated by oxygen or nitrogen,” explained Renyu Hu of NASA’s Jet Propulsion Laboratory in Southern California, who leads a team that will use Webb’s Near-Infrared Camera (NIRCam) and Mid-Infrared Instrument (MIRI) to capture the thermal emission spectrum of the day side of the planet. “If it has an atmosphere, [Webb] has the sensitivity and wavelength range to detect it and determine what it is made of,” Hu added.
Another intriguing possibility, however, is that 55 Cancri e is not tidally locked. Instead, it may be like Mercury, rotating three times for every two orbits (what’s known as a 3:2 resonance). As a result, the planet would have a day-night cycle.
[ Back to Top ]
By Jane J. Lee, Andrew Wang, NASA Jet Propulsion Laboratory
May 13, 2022
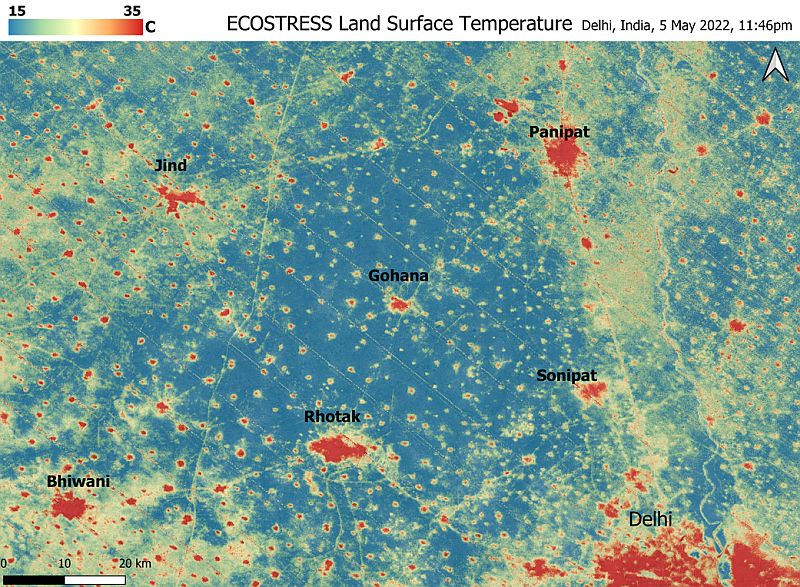
The instrument aboard the space station documents blistering temperatures in urban areas around Delhi during the historic heat wave on the Indian subcontinent.
A relentless heat wave has blanketed India and Pakistan since mid-March, causing dozens of deaths, fires, increased air pollution, and reduced crop yields. Weather forecasts show no prospect of relief any time soon. NASA’s Ecosystem Spaceborne Thermal Radiometer Experiment on Space Station instrument (ECOSTRESS) has been measuring these temperatures from space, at the highest spatial resolution of any satellite instrument.
This image, taken shortly before local midnight on May 5, shows urban areas and agricultural lands northwest of Delhi (the large red area in the lower right) that are home to about 28 million people. The image covers about 4,800 square miles (12,350 square kilometers).
Cities are usually markedly warmer than the surrounding countryside due to human activities and the materials used in the built environment. The image clearly delineates these urban “heat islands.” Nighttime temperatures in Delhi and several smaller villages were above 95 degrees Fahrenheit (35 degrees Celsius), peaking at about 102 degrees F (39 degrees C), while the rural fields nearby had cooled to around 60 degrees F (15 degrees C). This data suggests that city dwellers are experiencing considerably higher temperatures than the average temperatures reported for their regions.
ECOSTRESS measures the temperature of the ground itself, which is very similar to air temperature at night (though the ground may be warmer than the air in daylight hours). The instrument launched to the space station in 2018. Its primary mission is to identify plants’ thresholds for water use and water stress, giving insight into their ability to adapt to a warming climate. However, ECOSTRESS also records other heat-related phenomena, like this heat wave. With a pixel size of about 225 feet (70 meters) by 125 feet (38 meters), its high-resolution images serve as a powerful tool for understanding aspects of the weather event that might be overlooked by traditional observation networks.
NASA’s Jet Propulsion Laboratory in Southern California built and manages the ECOSTRESS mission for the Earth Science Division in the Science Mission Directorate at NASA Headquarters in Washington. ECOSTRESS is an Earth Venture Instrument mission; the program is managed by NASA’s Earth System Science Pathfinder program at NASA's Langley Research Center in Hampton, Virginia.
Get the this and links to related articles at https://www.nasa.gov/feature/jpl/nasa-s-ecostress-detects-heat-islands-in-extreme-indian-heat-wave.
[ Back to Top ]
By Sarah Frazier, NASA Headquarters
May 24, 2022
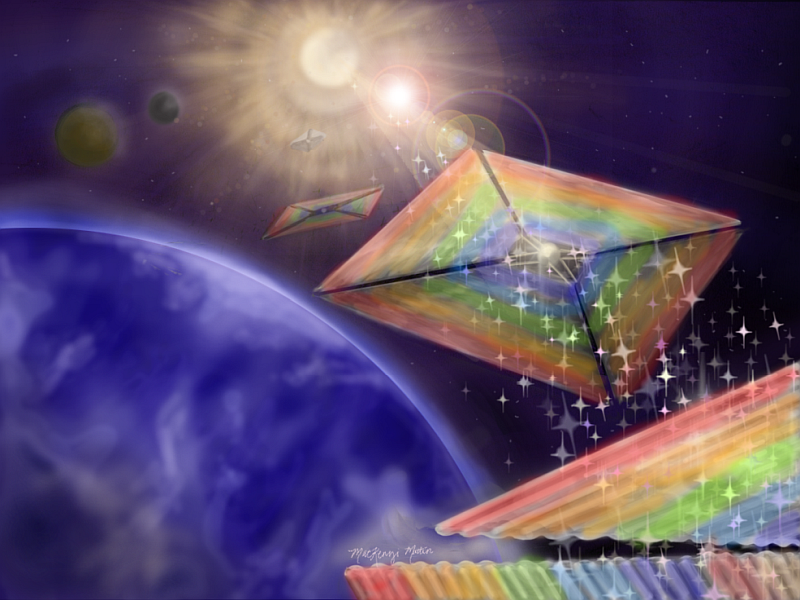
As NASA's exploration continues to push boundaries, a new solar sail concept selected by the agency for development toward a demonstration mission could carry science to new destinations.
The Diffractive Solar Sailing project was selected for Phase III study under the NASA Innovative Advanced Concepts (NIAC) program. Phase III aims to strategically transition NIAC concepts with the highest potential impact for NASA, other government agencies, or commercial partners.
“As we venture farther out into the cosmos than ever before, we’ll need innovative, cutting-edge technologies to drive our missions," said NASA Administrator Bill Nelson. "The NASA Innovative Advanced Concepts program helps to unlock visionary ideas – like novel solar sails – and bring them closer to reality.”
Like a sailboat using wind to cross the ocean, solar sails use the pressure exerted by sunlight to propel a craft through space. Existing reflective solar sail designs are typically very large and very thin, and they are limited by the direction of the sunlight, forcing tradeoffs between power and navigation. Diffractive lightsails would use small gratings embedded in thin films to take advantage of a property of light called diffraction, which causes light to spread out when it passes through a narrow opening. This would allow the spacecraft to make more efficient use of sunlight without sacrificing maneuverability.
“Exploring the universe means we need new instruments, new ideas, and new ways of going places," said Jim Reuter, associate administrator for NASA's Space Technology Mission Directorate (STMD) at NASA Headquarters in Washington. "Our goal is to invest in those technologies throughout their lifecycle to support a robust ecosystem of innovation.”
The new Phase III award will give the research team $2 million over two years to continue technology development in preparation for a potential future demonstration mission. The project is led by Amber Dubill of the Johns Hopkins University Applied Physics Laboratory in Laurel, Maryland.
"NIAC allows us to foster some of the most creative technology concepts in aerospace," said Mike LaPointe, acting program executive for the NIAC program at NASA Headquarters. "Our goal is to change the possible, and diffractive solar sailing promises to do just that for a number of exciting new mission applications."
[ Back to Top ]
By Calla Cofield, NASA Jet Propulsion Laboratory
May 18, 2022
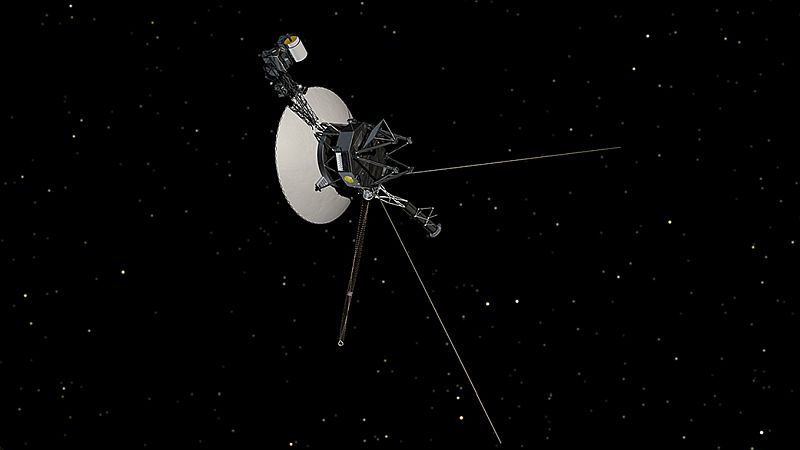
The engineering team with NASA’s Voyager 1 spacecraft is trying to solve a mystery: The interstellar explorer is operating normally, receiving and executing commands from Earth, along with gathering and returning science data. But readouts from the probe’s attitude articulation and control system (AACS) don’t reflect what’s actually happening onboard.
The AACS controls the 45-year-old spacecraft’s orientation. Among other tasks, it keeps Voyager 1’s high-gain antenna pointed precisely at Earth, enabling it to send data home. All signs suggest the AACS is still working, but the telemetry data it’s returning is invalid. For instance, the data may appear to be randomly generated, or does not reflect any possible state the AACS could be in.
The issue hasn’t triggered any onboard fault protection systems, which are designed to put the spacecraft into “safe mode” – a state where only essential operations are carried out, giving engineers time to diagnose an issue. Voyager 1’s signal hasn’t weakened, either, which suggests the high-gain antenna remains in its prescribed orientation with Earth.
The team will continue to monitor the signal closely as they continue to determine whether the invalid data is coming directly from the AACS or another system involved in producing and sending telemetry data. Until the nature of the issue is better understood, the team cannot anticipate whether this might affect how long the spacecraft can collect and transmit science data.
Voyager 1 is currently 14.5 billion miles (23.3 billion kilometers) from Earth, and it takes light 20 hours and 33 minutes to travel that difference. That means it takes roughly two days to send a message to Voyager 1 and get a response – a delay the mission team is well accustomed to.
“A mystery like this is sort of par for the course at this stage of the Voyager mission,” said Suzanne Dodd, project manager for Voyager 1 and 2 at NASA’s Jet Propulsion Laboratory in Southern California. “The spacecraft are both almost 45 years old, which is far beyond what the mission planners anticipated. We’re also in interstellar space – a high-radiation environment that no spacecraft have flown in before. So there are some big challenges for the engineering team. But I think if there’s a way to solve this issue with the AACS, our team will find it.”
[ Back to Top ]


By Michelle Smith, NASA Goddard Space Flight Center
May 26, 2022
On behalf of the National Oceanic and Atmospheric Administration (NOAA), NASA has selected two firms for the Geostationary Extended Observations (GeoXO) Ocean Color (OCX) instrument Phase A Study. These contracted firms will help meet the objectives of NOAA’s GeoXO Program.
The firms selected are Ball Aerospace of Boulder, Colorado and Raytheon Intelligence & Space, El Segundo, California. The total value of each of these twenty-month firm-fixed-price contracts is approximately $5.2 million. The work will be performed at the contractors’ facilities.
The principal purpose of these contracts is to provide a definition-phase study of a GeoXO OCX instrument, a hyperspectral, ultraviolet through near-infrared, passive imaging radiometer used to measure critical environmental data. OCX will provide up to hourly observations of ocean biology, chemistry, and ecology to assess ocean productivity, ecosystem change, coastal and inland water quality, seafood safety, and hazards like harmful algal blooms. High-resolution OCX observations will be an improvement over those offered by contemporary low-Earth orbiting ocean color sensors. From its position in geostationary orbit, OCX will view ocean and coastal conditions in real time and greatly improve the chance of cloud-free observations of areas of interest. The instrument will also track and assist in the response to climate-driven ocean and coastal ecosystem changes. These observations will support ecological forecasters, marine resource managers, fisheries, health departments, water treatment managers, and the commerce, recreation and tourism industries.
[ Back to Top ]
Josh Finch (NASA Headquarters); Brittney Thorpe, Jennifer Wolfinger (Kennedy Space Center); Dan Hout, Sandra Jones (John Space Center)
May 26, 2022
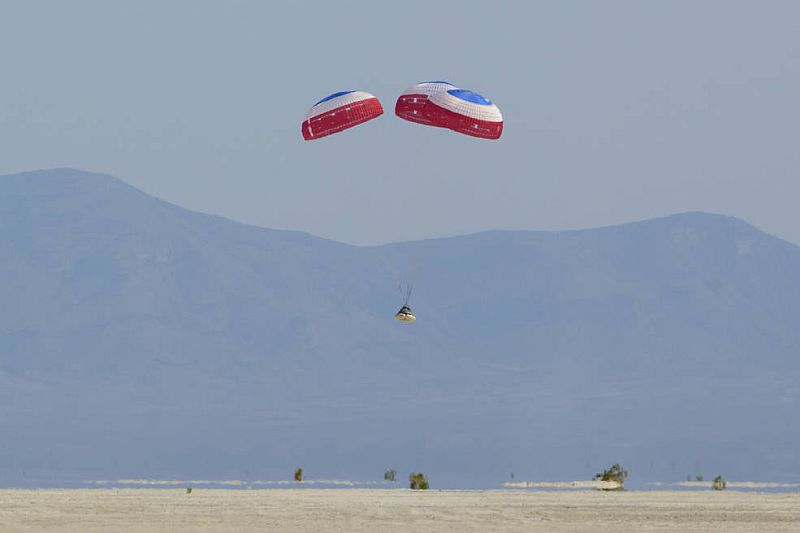
NASA and Boeing safely landed the company’s CST-100 Starliner spacecraft Wednesday in the desert of the western United States, completing the uncrewed Orbital Flight Test-2 (OFT-2) to the International Space Station to help prove the system is ready to fly astronauts.
About four hours after departing the space station, Starliner touched down onto its airbags at 4:49 p.m. MDT, wrapping up the six-day flight, which tested the end-to-end capabilities of the crew-capable spacecraft. The landing followed a deorbit burn at 4:05 p.m., separation of the spacecraft’s service module, and successful deployment of its three main parachutes and six airbags.
“NASA’s Commercial Crew Program and our industry partner, Boeing, today took a major and successful step on the journey to enabling more human spaceflight missions to the International Space Station on American spacecraft from American soil,” said NASA Administrator Bill Nelson. “The OFT-2 mission represents the power of collaboration, which allows us to innovate for the benefit of humanity and inspire the world through discovery. This golden era of spaceflight wouldn’t be possible without the thousands of individuals who persevered and poured their passion into this great achievement.”
As part of the flight test for NASA’s Commercial Crew Program, Boeing accomplished planned test objectives, including:
“I am incredibly proud of the dedication and perseverance shown by the NASA, Boeing and ULA team culminating in the successful completion of Starliner’s second Orbital Flight Test from start to finish,” said Steve Stich, manager, NASA’s Commercial Crew Program. “Throughout this process, Starliner has provided a tremendous amount of valuable data, which we’re continuing to assess in our effort to bring the spacecraft online and fully operational for crew flights to the space station as soon as it is safe to do so.”
The flight test began Thursday, May 19, when Starliner launched on the ULA Atlas V rocket from Space Launch Complex-41 at Cape Canaveral Space Force Station in Florida.
[ Back to Top ]
By Kim Orr, NASA Jetr Propulsion Laboratory
January 26, 2022
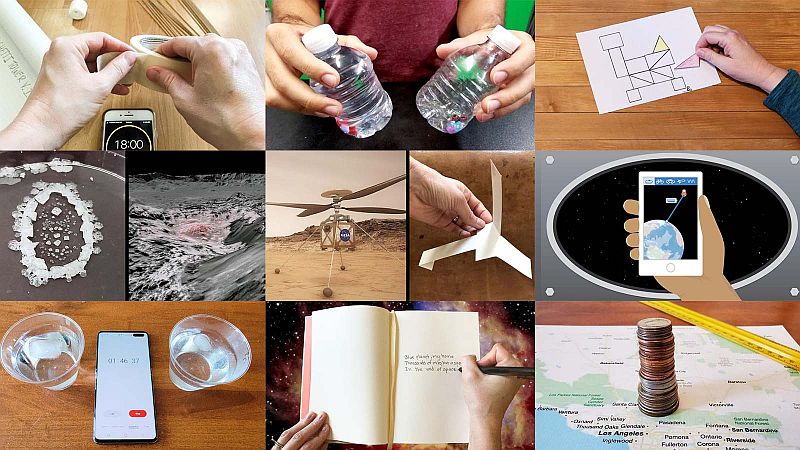
Calling all teachers pressed for time, substitutes looking for classroom activities that don't require a lot of prep, and others hoping to keep students learning in especially chaotic times: We've got a new collection of lessons and activities that you can quickly deploy.
Read on to explore our collection of Quick and Easy STEM lessons and student activities, organized by grade band. Get everything you need to guide students through standards-aligned lessons featuring connections to real NASA missions and science as well as links to student projects, which can be led by teachers or assigned as independent activities.
[ Back to Top ]
From NOAA News & Features
December 22, 2021

Do you have kids or students craving online games? Then NOAA’s Planet Arcade is the perfect place for today’s young gamers to experience the world of science through gaming, especially over the holidays and school breaks.
The arcade is a portal to 26 educational games and interactive activities — all focused on ocean science and the environment. Featured games include:
Visit games.noaa.gov to play today!
See this and related features at https://www.noaa.gov/stories/science-is-kids-play-online-games-for-school-breaks-or-anytime-at-all.
[ Back to Top ]


Weather satellites are classified by their orbit type: polar or equatorial. What is the difference between these orbit types? Are the satellites in each type of orbit the same? Does each “see” the Earth in the same way as the other? In this lesson, students are guided to think about, and discuss in small groups, Earth-looking satellites and their orbits as they tackle problems posed by the teacher. They will end the lesson by working in small groups to create their own model describing and comparing two types of satellites orbits before individually reporting their findings in writing
This lesson can serve as a stand-alone lesson, modified for use in a more complex unit of study, used in focus-setting, formative or summative assessment, or closure.
| Grade Level: | 5-8 |
| Time Requirement: | 1 class period |
| Prerequisites: | None |
| Relevant Disciplines: | Physical Science, Earth & Space Science |
[ Back to Top ]
Share your satellite-based lesson ideas with the teaching comunity.
Send us a full lesson plan, or simply suggest a lesson idea. If you found the idea online, please share the source as well. The lesson can be about anything that helps connect learners with satellite-based technology - any grade level K-12 - any STEM subject area or geography.
"Satellite-technology" includes any part of the science, math, engineering, or technology of satellites, rockets, and remote sensing instruments as well as the use of any environmental satellite data to explore questions related to aspects of global change and local impacts in the long term, short term, and catastrophic time frames. Of special interest are lessons providing oppotunities for learners to inquire, experiment, and apply mathematics.
Perhaps you designed a lesson yourself - we will happily prepare it for future publication in More Lessons from the Sky and inclusion in the SEA Lesson Plan Library. Perhaps you found a worthy lesson plan published elsewhere - we can research it inclusion in a lesson plan spotlight. In either case, you will receive full credit for developing and/or brining theless to the attendtion of the teaching community. Don't forget to share your insights if you tried the lesson with students.
Send your ideas to SEA.Lessons@SatEd.org.
[ Back to Top ]

![]()

This edition of the SEA Newsletter was produced in HTML5.
It is best viewed with most recent updates of Firefox, Edge, Chrome, Opera, or Safari.
©Satellite Educators Association, Inc. https://SatEd.org SEA.Newsletter@SatEd.org
Satellite Educators Association, Inc. is a 501(c)(3) non-profit educational organization.
The SEA Newsletter is published on-line monthly except January and August and available at no cost.
SEA terms, conditions, policies, ansd contact information are detailed HERE.
Unless otherwise listed, all photo and image credits are the authors of the articles.
Any opinons expressed in this Newsletter are those of the authors
and not necessarily those of the Satellite Educators Association, Inc.
or any of its officers, members, or representatives.
Many SEA Newsletter items contain third-party links to sites not governed by Satellite
Educators Association, Inc. The viewer is cautioned to be aware of the terms of use and
privacy policies for those third-party sites.![]()